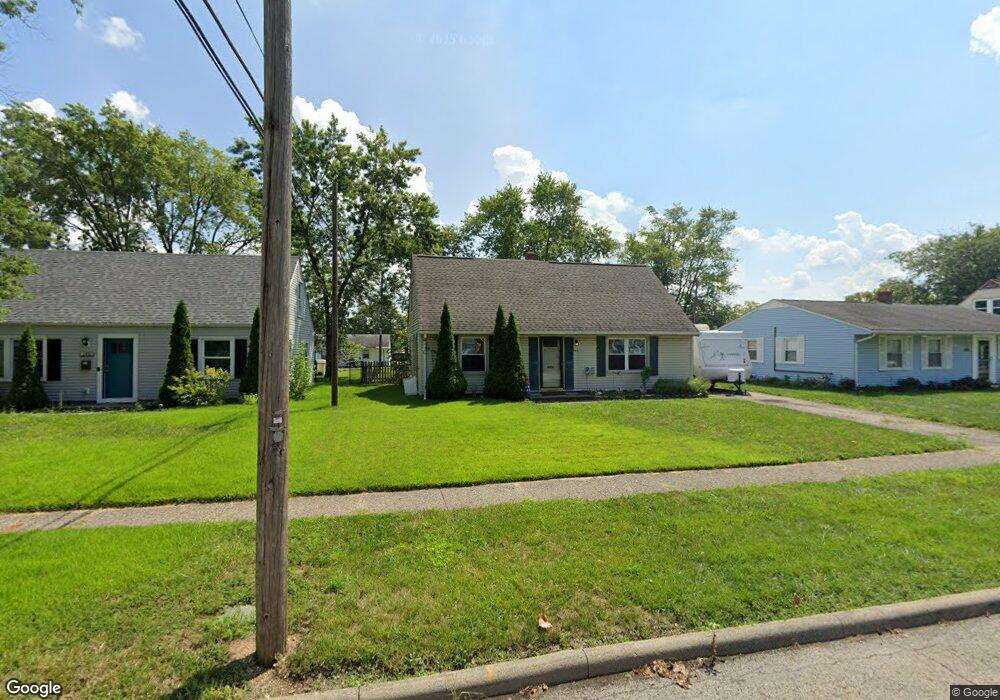
240 Sturbridge Rd Columbus, OH 43228
Estimated Value: $209,088 - $240,000
4
Beds
2
Baths
1,369
Sq Ft
$164/Sq Ft
Est. Value
About This Home
This home is located at 240 Sturbridge Rd, Columbus, OH 43228 and is currently estimated at $225,022, approximately $164 per square foot. 240 Sturbridge Rd is a home located in Franklin County with nearby schools including Prairie Lincoln Elementary School, Galloway Ridge Intermediate School, and Norton Middle School.
Ownership History
Date
Name
Owned For
Owner Type
Purchase Details
Closed on
Aug 11, 2023
Sold by
Falke Douglas B and Falke Jennifer J
Bought by
Falke Douglas B
Current Estimated Value
Home Financials for this Owner
Home Financials are based on the most recent Mortgage that was taken out on this home.
Original Mortgage
$137,362
Outstanding Balance
$134,232
Interest Rate
6.81%
Mortgage Type
FHA
Estimated Equity
$90,790
Purchase Details
Closed on
Aug 2, 1995
Sold by
Johnson Margaret L
Bought by
Falke Douglas B and Falke Jennifer J
Home Financials for this Owner
Home Financials are based on the most recent Mortgage that was taken out on this home.
Original Mortgage
$69,836
Interest Rate
7.56%
Mortgage Type
FHA
Create a Home Valuation Report for This Property
The Home Valuation Report is an in-depth analysis detailing your home's value as well as a comparison with similar homes in the area
Home Values in the Area
Average Home Value in this Area
Purchase History
| Date | Buyer | Sale Price | Title Company |
|---|---|---|---|
| Falke Douglas B | -- | Mortgage Connect | |
| Falke Douglas B | $69,900 | -- |
Source: Public Records
Mortgage History
| Date | Status | Borrower | Loan Amount |
|---|---|---|---|
| Open | Falke Douglas B | $137,362 | |
| Previous Owner | Falke Douglas B | $69,836 |
Source: Public Records
Tax History Compared to Growth
Tax History
| Year | Tax Paid | Tax Assessment Tax Assessment Total Assessment is a certain percentage of the fair market value that is determined by local assessors to be the total taxable value of land and additions on the property. | Land | Improvement |
|---|---|---|---|---|
| 2024 | $2,527 | $55,300 | $17,080 | $38,220 |
| 2023 | $2,420 | $55,300 | $17,080 | $38,220 |
| 2022 | $2,149 | $34,410 | $3,710 | $30,700 |
| 2021 | $2,183 | $34,410 | $3,710 | $30,700 |
| 2020 | $2,162 | $34,410 | $3,710 | $30,700 |
| 2019 | $2,143 | $29,790 | $3,120 | $26,670 |
| 2018 | $2,064 | $29,790 | $3,120 | $26,670 |
| 2017 | $2,008 | $29,790 | $3,120 | $26,670 |
| 2016 | $1,992 | $26,780 | $6,020 | $20,760 |
| 2015 | $1,992 | $26,780 | $6,020 | $20,760 |
| 2014 | $1,958 | $26,780 | $6,020 | $20,760 |
| 2013 | $1,152 | $31,500 | $7,070 | $24,430 |
Source: Public Records
Map
Nearby Homes
- 316 Sturbridge Rd
- 450 Lawrence Ave
- 1518 Forbes Ave
- 89 Postle Blvd
- 87 Tarryton Ct W Unit 18D
- 141 Beacon Run W Unit 26E
- 5409 Longworth Dr
- 4696 Tarryton Ct S Unit 7-2D
- 271 Carilla Ln
- 5504 Inglecrest Place
- 218 Darbyhurst Rd
- 74 Tarryton Ct E Unit 10A
- 4589 Annhurst Rd
- 264 Woodlawn Ave
- 212 Charing Cross St
- 4637 Hilton Ave
- 429 Postle Blvd
- 376 Galloway Ridge Dr
- 299 Lombard Rd
- 378 Millett Dr
- 232 Sturbridge Rd
- 248 Sturbridge Rd
- 224 Sturbridge Rd
- 256 Sturbridge Rd
- 229 Topsfield Rd
- 235 Topsfield Rd
- 223 Topsfield Rd
- 216 Sturbridge Rd
- 264 Sturbridge Rd
- 233 Sturbridge Rd
- 249 Sturbridge Rd
- 215 Topsfield Rd
- 223 Sturbridge Rd
- 247 Topsfield Rd
- 257 Sturbridge Rd
- 208 Sturbridge Rd
- 217 Sturbridge Rd
- 205 Topsfield Rd
- 265 Sturbridge Rd
- 270 Sturbridge Rd