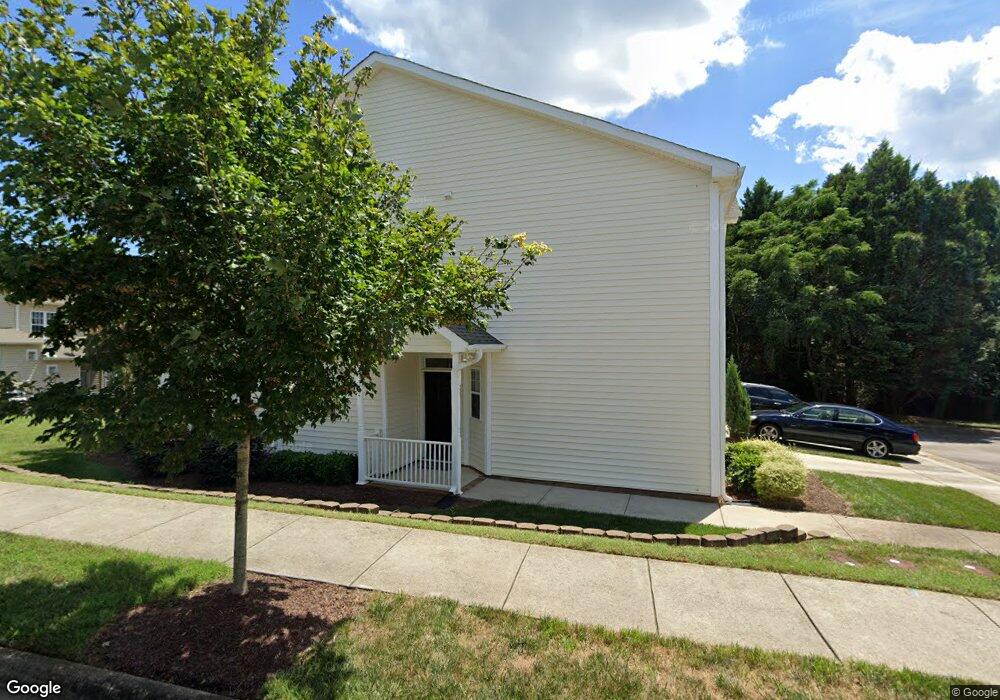
240 Sugar Maple Ave Wake Forest, NC 27587
Estimated Value: $300,000 - $344,000
3
Beds
3
Baths
1,797
Sq Ft
$180/Sq Ft
Est. Value
About This Home
This home is located at 240 Sugar Maple Ave, Wake Forest, NC 27587 and is currently estimated at $322,577, approximately $179 per square foot. 240 Sugar Maple Ave is a home located in Wake County with nearby schools including Wake Forest Elementary School, Wake Forest-Rolesville Middle School, and Wake Forest High School.
Ownership History
Date
Name
Owned For
Owner Type
Purchase Details
Closed on
Jun 30, 2020
Sold by
Edwards Courtney Augustus and Edwards Rachel Christina
Bought by
Cameron Tricia N
Current Estimated Value
Home Financials for this Owner
Home Financials are based on the most recent Mortgage that was taken out on this home.
Original Mortgage
$207,662
Outstanding Balance
$184,483
Interest Rate
3.2%
Mortgage Type
New Conventional
Estimated Equity
$138,094
Purchase Details
Closed on
Dec 1, 2010
Sold by
Valley Oak Company
Bought by
Jobe Michael B and Jobe Kristen S
Home Financials for this Owner
Home Financials are based on the most recent Mortgage that was taken out on this home.
Original Mortgage
$142,901
Interest Rate
4.3%
Mortgage Type
New Conventional
Purchase Details
Closed on
Mar 25, 2010
Sold by
Bannerman & Co
Bought by
Valley Oak Company
Create a Home Valuation Report for This Property
The Home Valuation Report is an in-depth analysis detailing your home's value as well as a comparison with similar homes in the area
Home Values in the Area
Average Home Value in this Area
Purchase History
| Date | Buyer | Sale Price | Title Company |
|---|---|---|---|
| Cameron Tricia N | $216,000 | None Available | |
| Cameron Tricia N | $216,000 | None Listed On Document | |
| Jobe Michael B | $138,000 | None Available | |
| Valley Oak Company | $85,000 | None Available |
Source: Public Records
Mortgage History
| Date | Status | Borrower | Loan Amount |
|---|---|---|---|
| Open | Cameron Tricia N | $207,662 | |
| Closed | Cameron Tricia N | $207,662 | |
| Previous Owner | Jobe Michael B | $142,901 |
Source: Public Records
Tax History Compared to Growth
Tax History
| Year | Tax Paid | Tax Assessment Tax Assessment Total Assessment is a certain percentage of the fair market value that is determined by local assessors to be the total taxable value of land and additions on the property. | Land | Improvement |
|---|---|---|---|---|
| 2025 | $3,096 | $323,512 | $60,000 | $263,512 |
| 2024 | $3,084 | $323,512 | $60,000 | $263,512 |
| 2023 | $2,375 | $202,628 | $30,000 | $172,628 |
| 2022 | $2,278 | $202,628 | $30,000 | $172,628 |
| 2021 | $2,239 | $202,628 | $30,000 | $172,628 |
| 2020 | $2,239 | $202,628 | $30,000 | $172,628 |
| 2019 | $1,899 | $151,437 | $20,000 | $131,437 |
| 2018 | $1,798 | $151,437 | $20,000 | $131,437 |
| 2017 | $1,739 | $151,437 | $20,000 | $131,437 |
| 2016 | $1,717 | $151,437 | $20,000 | $131,437 |
| 2015 | $1,912 | $166,778 | $28,000 | $138,778 |
| 2014 | $1,851 | $166,778 | $28,000 | $138,778 |
Source: Public Records
Map
Nearby Homes
- 300 Sugar Maple Ave
- 821 Silver Linden Ln
- 212 Sugar Maple Ave
- 605 Hyperion Alley
- 601 Callan View Ave
- 600 Callan View Ave
- 602 Callan View Ave
- 1170 Holding Village Way
- 606 Callan View Ave
- 608 Callan View Ave
- 610 Callan View Ave
- 601 Brackenberry Alley
- 1106 Holding Village Way
- 1110 Holding Village Way
- 1112 Holding Village Way
- 1114 Holding Village Way
- 607 Brackenberry Alley
- 829 S Franklin St
- 1204 Holding Village Way
- 1208 Holding Village Way
- 238 Sugar Maple Ave
- 238 Sugar Maple Ave Unit 9
- 240 Sugar Maple Ave Unit 10
- 242 Sugar Maple Ave
- 306 Sugar Maple Ave
- 304 Sugar Maple Ave
- 302 Sugar Maple Ave
- 230 Sugar Maple Ave
- unit 3 Sugar Maple Ave
- unit 2 Sugar Maple Ave
- 0 Sugar Maple Ave Unit TR1813853
- 0 Sugar Maple Ave Unit 1753467
- 0 Sugar Maple Ave
- 228 Sugar Maple Ave
- 241 Sugar Maple Ave
- 239 Sugar Maple Ave
- 237 Sugar Maple Ave
- 235 Sugar Maple Ave
- 226 Sugar Maple Ave
- 233 Sugar Maple Ave