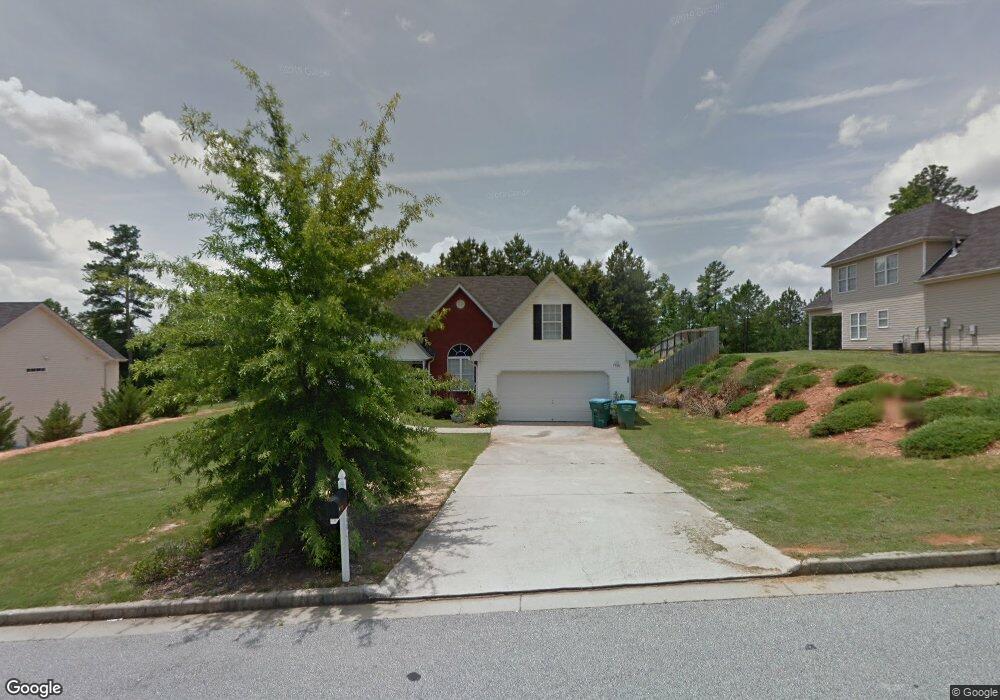
240 Towler Shoals Dr Unit 7 Loganville, GA 30052
Estimated Value: $301,000 - $343,000
--
Bed
--
Bath
1,688
Sq Ft
$190/Sq Ft
Est. Value
About This Home
This home is located at 240 Towler Shoals Dr Unit 7, Loganville, GA 30052 and is currently estimated at $320,692, approximately $189 per square foot. 240 Towler Shoals Dr Unit 7 is a home located in Walton County with nearby schools including Bay Creek Elementary School, Loganville Middle School, and Loganville High School.
Ownership History
Date
Name
Owned For
Owner Type
Purchase Details
Closed on
Nov 8, 2019
Sold by
Ih3 Property Georgia Lp
Bought by
Swh 2017 1 Borrower Lp
Current Estimated Value
Home Financials for this Owner
Home Financials are based on the most recent Mortgage that was taken out on this home.
Original Mortgage
$771,240,000
Interest Rate
3.5%
Mortgage Type
Commercial
Purchase Details
Closed on
Nov 5, 2013
Sold by
Switzer Heather F
Bought by
Ih3 Property Georgia Lp
Purchase Details
Closed on
Dec 18, 2003
Sold by
Montana Hms Inc
Bought by
Switzer Heather F and Switzer John D
Home Financials for this Owner
Home Financials are based on the most recent Mortgage that was taken out on this home.
Original Mortgage
$27,261
Interest Rate
5.82%
Mortgage Type
New Conventional
Create a Home Valuation Report for This Property
The Home Valuation Report is an in-depth analysis detailing your home's value as well as a comparison with similar homes in the area
Home Values in the Area
Average Home Value in this Area
Purchase History
| Date | Buyer | Sale Price | Title Company |
|---|---|---|---|
| Swh 2017 1 Borrower Lp | -- | -- | |
| Ih3 Property Georgia Lp | -- | -- | |
| Switzer Heather F | -- | -- |
Source: Public Records
Mortgage History
| Date | Status | Borrower | Loan Amount |
|---|---|---|---|
| Closed | Swh 2017 1 Borrower Lp | $771,240,000 | |
| Previous Owner | Switzer Heather F | $27,261 | |
| Previous Owner | Switzer Heather F | $166,003 |
Source: Public Records
Tax History Compared to Growth
Tax History
| Year | Tax Paid | Tax Assessment Tax Assessment Total Assessment is a certain percentage of the fair market value that is determined by local assessors to be the total taxable value of land and additions on the property. | Land | Improvement |
|---|---|---|---|---|
| 2024 | $4,145 | $111,280 | $12,499 | $98,781 |
| 2023 | $4,293 | $111,280 | $12,499 | $98,781 |
| 2022 | $3,370 | $111,280 | $18,400 | $92,880 |
| 2021 | $2,548 | $81,560 | $16,000 | $65,560 |
| 2020 | $2,455 | $76,520 | $12,800 | $63,720 |
| 2019 | $1,955 | $61,480 | $12,000 | $49,480 |
| 2018 | $1,974 | $61,480 | $12,000 | $49,480 |
| 2017 | $2,709 | $61,480 | $12,000 | $49,480 |
| 2016 | $1,760 | $52,640 | $10,000 | $42,640 |
| 2015 | $1,630 | $48,160 | $9,400 | $38,760 |
| 2014 | $1,297 | $38,880 | $8,000 | $30,880 |
Source: Public Records
Map
Nearby Homes
- 165 Towler Shoals Dr
- 2414 Anhinga Dr
- 2404 Anhinga Dr
- 808 Tucker Trail
- 3291 Pepperpike Ct
- 625 Moorhen Way
- 1418 Cherry Bark Ct
- 0 Claude Brewer Rd Unit 10376791
- 0 Claude Brewer Rd Unit 7454668
- 2444 Anhinga Dr
- 2484 Anhinga Dr
- 2519 Anhinga Dr
- 208 Evergreen Way
- 240 Chandler Walk
- 2241 Baker Carter Dr Unit 2
- 3651 Chandler Haulk Rd
- 703 Bristol Dr
- 703 Bristol Dr Unit 149A
- 705 Bristol Dr
- 705 Bristol Dr Unit 148A
- 242 Towler Shoals Dr Unit 7
- 238 Towler Shoals Dr Unit 7
- 404 Towler Walk Unit 7
- 406 Towler Walk
- 236 Towler Shoals Dr
- 244 Towler Shoals Dr
- 239 Towler Shoals Dr
- 241 Towler Shoals Dr
- 237 Towler Shoals Dr
- 307 Towler Crossing
- 309 Towler Crossing
- 309 Towler Crossing Unit 309
- 243 Towler Shoals Dr Unit 7
- 235 Towler Shoals Dr
- 234 Towler Shoals Dr
- 234 Towler Shoals Dr Unit 80
- 301 Towler Crossing
- 405 Towler Walk Unit 7
- 305 Towler Crossing
- 305 Towler Crossing Unit 7