240 Trails End Dr Unit 25 Demorest, GA 30535
Estimated Value: $456,000 - $747,000
3
Beds
3
Baths
2,494
Sq Ft
$233/Sq Ft
Est. Value
About This Home
This home is located at 240 Trails End Dr Unit 25, Demorest, GA 30535 and is currently estimated at $580,531, approximately $232 per square foot. 240 Trails End Dr Unit 25 is a home located in Habersham County with nearby schools including Fairview Elementary School, South Habersham Middle School, and Habersham Success Academy.
Ownership History
Date
Name
Owned For
Owner Type
Purchase Details
Closed on
Jan 10, 2019
Sold by
Reinfandt Karl
Bought by
Runowicz David James and Runowicz Donna Peace
Current Estimated Value
Home Financials for this Owner
Home Financials are based on the most recent Mortgage that was taken out on this home.
Original Mortgage
$300,000
Outstanding Balance
$263,761
Interest Rate
4.6%
Mortgage Type
New Conventional
Estimated Equity
$316,770
Purchase Details
Closed on
Jun 10, 2016
Sold by
Maul I Darroll
Bought by
Reinfandt Karl and Reinfandt Heike
Purchase Details
Closed on
Jun 30, 2005
Sold by
Clyatt W L
Bought by
Maul I Darroll and Maul Barbara J
Home Financials for this Owner
Home Financials are based on the most recent Mortgage that was taken out on this home.
Original Mortgage
$170,000
Interest Rate
5.54%
Mortgage Type
New Conventional
Create a Home Valuation Report for This Property
The Home Valuation Report is an in-depth analysis detailing your home's value as well as a comparison with similar homes in the area
Home Values in the Area
Average Home Value in this Area
Purchase History
| Date | Buyer | Sale Price | Title Company |
|---|---|---|---|
| Runowicz David James | $375,000 | -- | |
| Reinfandt Karl | $315,000 | -- | |
| Maul I Darroll | $291,900 | -- |
Source: Public Records
Mortgage History
| Date | Status | Borrower | Loan Amount |
|---|---|---|---|
| Open | Runowicz David James | $300,000 | |
| Previous Owner | Maul I Darroll | $170,000 |
Source: Public Records
Tax History Compared to Growth
Tax History
| Year | Tax Paid | Tax Assessment Tax Assessment Total Assessment is a certain percentage of the fair market value that is determined by local assessors to be the total taxable value of land and additions on the property. | Land | Improvement |
|---|---|---|---|---|
| 2025 | $1,776 | $183,424 | $33,600 | $149,824 |
| 2024 | -- | $237,772 | $33,600 | $204,172 |
| 2023 | $1,675 | $202,316 | $33,600 | $168,716 |
| 2022 | $1,845 | $178,232 | $33,600 | $144,632 |
| 2021 | $3,514 | $153,616 | $25,200 | $128,416 |
| 2020 | $3,387 | $135,500 | $25,200 | $110,300 |
| 2019 | $1,511 | $135,500 | $25,200 | $110,300 |
| 2018 | $1,479 | $135,500 | $25,200 | $110,300 |
| 2017 | $1,394 | $125,424 | $25,200 | $100,224 |
| 2016 | $1,169 | $276,380 | $25,200 | $85,352 |
| 2015 | $1,129 | $276,380 | $25,200 | $85,352 |
| 2014 | $1,116 | $270,050 | $25,200 | $82,820 |
| 2013 | -- | $108,020 | $25,200 | $82,820 |
Source: Public Records
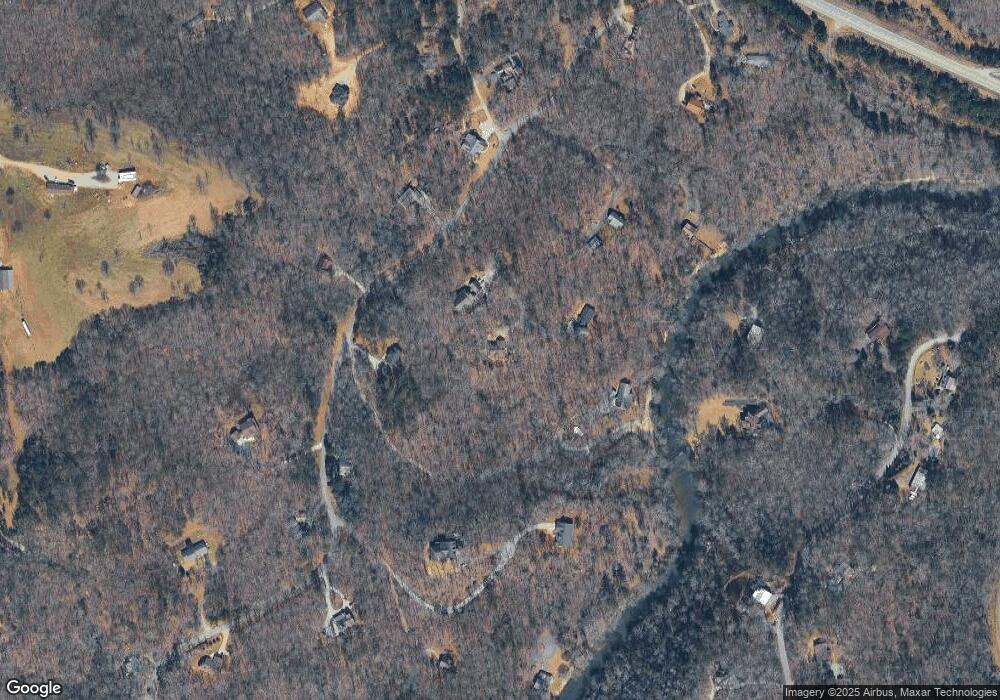
Map
Nearby Homes
- 0 N Falling Waters Dr Unit LOT 32B
- 512 Olde Rockhouse Ln
- LOT 4 Olde Rockhouse Ln
- 186 Sweetbriar Dr Unit LOT 10
- 186 Sweetbriar Dr
- 500 Cross Creek Trail
- 240 Canyon Point Dr
- 264 Canyon Point Dr
- 0 Twin River Orchard Rd Unit 7194756
- 0 Twin River Orchard Rd Unit 20112390
- 161 Twisting Ridge Trail
- 1177 Twin River Orchard Rd
- 663 Wheeler Rd
- 329 Twisting Ridge Trail
- 8.5 +/- Smith Loop
- 155 Brentwood Dr
- 7 ACRES Wheeler Rd
- 0 Wheeler Rd Unit 22579726
- 2600 Georgia 115
- 573 Mineral Springs Trl Conn
- 240 Trails End Dr
- 120 Trails End Dr
- 189 Trails End Dr
- 33 Falling Water Dr
- 269 Honeysuckle Trail SW
- 269 Honeysuckle Trail SW Unit 24, Block B
- 120 Honeysuckle Trail SW
- 288 N Falling Waters Dr
- 235 N Falling Waters Dr
- 463 N Falling Waters Dr
- 0 High Vista Terrace Unit 4 8308116
- 0 High Vista Terrace Unit 4 8238055
- 0 High Vista Terrace Unit LOT 2
- 0 High Vista Terrace Unit 20107290
- 0 High Vista Terrace Unit 20022275
- 0 High Vista Terrace Unit Lot 2 8493667
- 301 Whispering Waters Unit 39
- 301 Whispering Waters
- 115 Kates Orchard Ln
- 310 N Falling Waters Dr