2400 Brookgreen Ct Bedford, TX 76021
Estimated Value: $479,000 - $525,000
4
Beds
2
Baths
2,504
Sq Ft
$196/Sq Ft
Est. Value
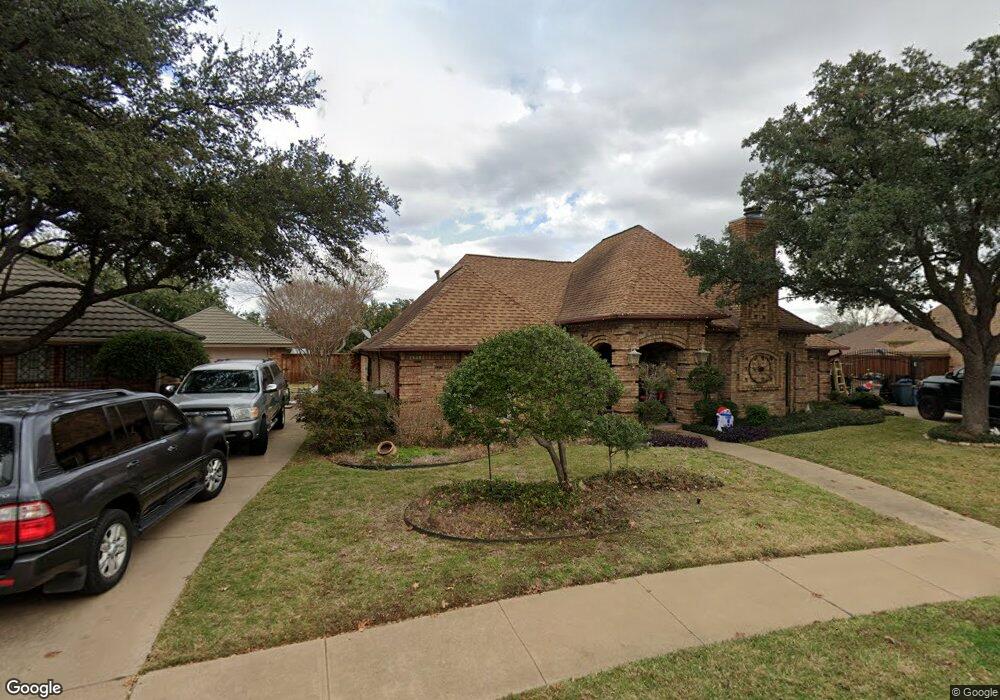
About This Home
This home is located at 2400 Brookgreen Ct, Bedford, TX 76021 and is currently estimated at $491,594, approximately $196 per square foot. 2400 Brookgreen Ct is a home located in Tarrant County with nearby schools including Shady Brook Elementary School, Bedford Junior High School, and L.D. Bell High School.
Ownership History
Date
Name
Owned For
Owner Type
Purchase Details
Closed on
Sep 24, 2020
Sold by
Williams Russell D
Bought by
Thomas Jeffrey and Thomas Dennis Brianna
Current Estimated Value
Home Financials for this Owner
Home Financials are based on the most recent Mortgage that was taken out on this home.
Original Mortgage
$365,750
Outstanding Balance
$325,315
Interest Rate
2.9%
Mortgage Type
New Conventional
Estimated Equity
$166,279
Purchase Details
Closed on
Nov 16, 2018
Sold by
Saunders Julie
Bought by
Williams Russell D
Home Financials for this Owner
Home Financials are based on the most recent Mortgage that was taken out on this home.
Original Mortgage
$311,355
Interest Rate
5.75%
Mortgage Type
FHA
Purchase Details
Closed on
Sep 2, 2015
Sold by
Saunders Chris
Bought by
Saunders Julie
Purchase Details
Closed on
Aug 15, 2001
Sold by
Rodante Thomas V and Rodante Mary
Bought by
Saunders Chris
Home Financials for this Owner
Home Financials are based on the most recent Mortgage that was taken out on this home.
Original Mortgage
$148,443
Interest Rate
7.14%
Mortgage Type
FHA
Create a Home Valuation Report for This Property
The Home Valuation Report is an in-depth analysis detailing your home's value as well as a comparison with similar homes in the area
Home Values in the Area
Average Home Value in this Area
Purchase History
| Date | Buyer | Sale Price | Title Company |
|---|---|---|---|
| Thomas Jeffrey | -- | None Listed On Document | |
| Williams Russell D | -- | None Available | |
| Saunders Julie | -- | None Available | |
| Saunders Chris | -- | American Title Co |
Source: Public Records
Mortgage History
| Date | Status | Borrower | Loan Amount |
|---|---|---|---|
| Open | Thomas Jeffrey | $365,750 | |
| Previous Owner | Williams Russell D | $311,355 | |
| Previous Owner | Saunders Chris | $148,443 |
Source: Public Records
Tax History Compared to Growth
Tax History
| Year | Tax Paid | Tax Assessment Tax Assessment Total Assessment is a certain percentage of the fair market value that is determined by local assessors to be the total taxable value of land and additions on the property. | Land | Improvement |
|---|---|---|---|---|
| 2025 | $8,221 | $422,264 | $90,000 | $332,264 |
| 2024 | $8,221 | $422,264 | $90,000 | $332,264 |
| 2023 | $8,626 | $449,740 | $65,000 | $384,740 |
| 2022 | $8,772 | $401,619 | $65,000 | $336,619 |
| 2021 | $8,389 | $356,141 | $65,000 | $291,141 |
| 2020 | $8,008 | $336,813 | $65,000 | $271,813 |
| 2019 | $8,496 | $349,723 | $65,000 | $284,723 |
| 2018 | $6,769 | $294,367 | $65,000 | $229,367 |
| 2017 | $6,431 | $274,321 | $40,000 | $234,321 |
| 2016 | $5,846 | $254,228 | $40,000 | $214,228 |
| 2015 | $5,242 | $219,700 | $28,000 | $191,700 |
| 2014 | $5,242 | $219,700 | $28,000 | $191,700 |
Source: Public Records
Map
Nearby Homes
- 2420 Stonegate Dr N
- 2436 Brookgreen Ct
- 817 Shady Lake Dr
- 1740 Brown Trail
- 2225 Shady Brook Dr
- 2317 Shady Grove Dr
- 2501 Shady Grove Dr
- 2116 Tamworth Ct
- 922 Shady Creek Ln
- 2508 Lakeview Dr
- 801 Shady Creek Ln
- 2700 Shady Grove Dr
- 1013 Springdale Rd
- 2704 Shady Grove Dr
- 432 Sunnybrook Ct
- 1732 Jeannie Ln
- 3119 Spring Grove Dr
- 124 Jeannie Ct
- 121 Kay Ct
- 258 Somerset Terrace
- 2404 Brookgreen Ct
- 804 Windmill Ct
- 2416 Stonegate Dr N
- 808 Windmill Ct
- 2428 Stonegate Dr N
- 2412 Stonegate Dr N
- 2408 Brookgreen Ct
- 2401 Brookgreen Ct
- 801 Windmill Ct
- 2408 Stonegate Dr N
- 2432 Stonegate Dr N
- 805 Windmill Ct
- 812 Windmill Ct
- 2412 Brookgreen Ct
- 2421 Stonegate Dr N
- 2417 Stonegate Dr N
- 2425 Stonegate Dr N
- 2405 Brookgreen Ct
- 840 Birdsong
- 809 Windmill Ct