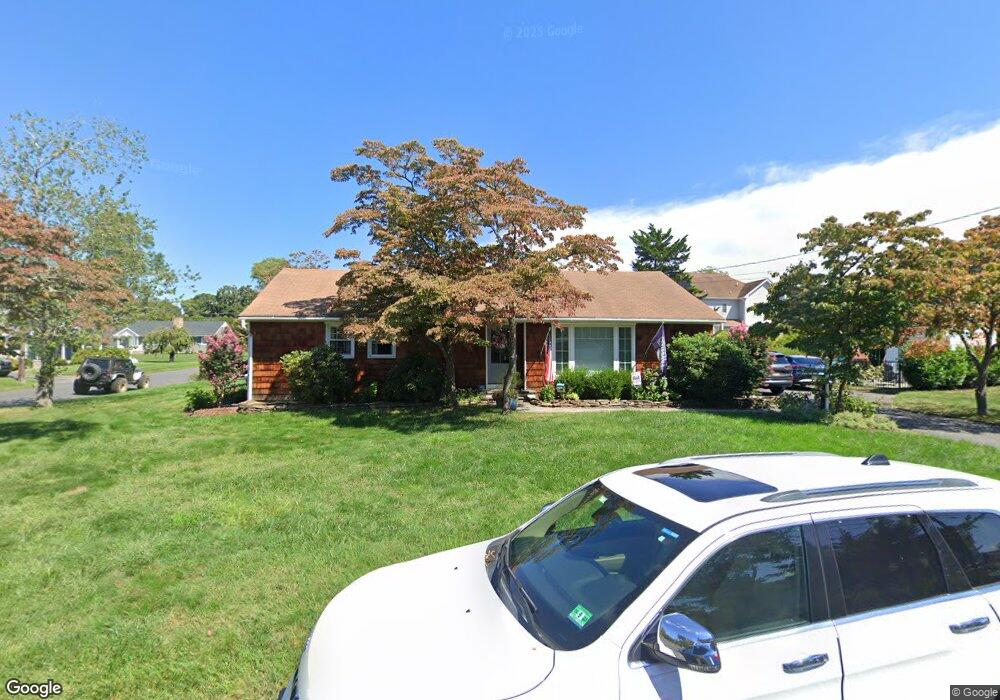
2400 Cypress St Manasquan, NJ 08736
Estimated Value: $783,000 - $880,000
3
Beds
2
Baths
1,344
Sq Ft
$612/Sq Ft
Est. Value
About This Home
This home is located at 2400 Cypress St, Manasquan, NJ 08736 and is currently estimated at $821,875, approximately $611 per square foot. 2400 Cypress St is a home located in Monmouth County with nearby schools including Wall High School and The Brookside School.
Ownership History
Date
Name
Owned For
Owner Type
Purchase Details
Closed on
Apr 18, 2022
Sold by
Paul Amato
Bought by
Onacilla Matthew and Onacilla Krystin
Current Estimated Value
Home Financials for this Owner
Home Financials are based on the most recent Mortgage that was taken out on this home.
Original Mortgage
$548,000
Outstanding Balance
$514,258
Interest Rate
4.16%
Mortgage Type
New Conventional
Estimated Equity
$307,617
Purchase Details
Closed on
Mar 20, 2020
Sold by
Rutledge James A and Rutledge Laurie
Bought by
Amato Paul and Amato Joyce
Home Financials for this Owner
Home Financials are based on the most recent Mortgage that was taken out on this home.
Original Mortgage
$315,000
Interest Rate
3.4%
Mortgage Type
Commercial
Purchase Details
Closed on
Jun 8, 2010
Sold by
Rutledge Alfred C
Bought by
Rutledge James A and Rutledge Laurie
Create a Home Valuation Report for This Property
The Home Valuation Report is an in-depth analysis detailing your home's value as well as a comparison with similar homes in the area
Home Values in the Area
Average Home Value in this Area
Purchase History
| Date | Buyer | Sale Price | Title Company |
|---|---|---|---|
| Onacilla Matthew | $685,000 | Chicago Title | |
| Onacilla Matthew | $685,000 | Chicago Title | |
| Amato Paul | $422,500 | Trident Abstract Ttl Agcy Ll | |
| Rutledge James A | -- | None Available |
Source: Public Records
Mortgage History
| Date | Status | Borrower | Loan Amount |
|---|---|---|---|
| Open | Onacilla Matthew | $548,000 | |
| Closed | Onacilla Matthew | $548,000 | |
| Previous Owner | Amato Paul | $315,000 |
Source: Public Records
Tax History Compared to Growth
Tax History
| Year | Tax Paid | Tax Assessment Tax Assessment Total Assessment is a certain percentage of the fair market value that is determined by local assessors to be the total taxable value of land and additions on the property. | Land | Improvement |
|---|---|---|---|---|
| 2025 | $8,719 | $413,200 | $235,000 | $178,200 |
| 2024 | $8,458 | $413,200 | $235,000 | $178,200 |
| 2023 | $8,458 | $413,200 | $235,000 | $178,200 |
| 2022 | $7,477 | $374,400 | $235,000 | $139,400 |
| 2021 | $7,477 | $374,400 | $235,000 | $139,400 |
| 2020 | $7,387 | $374,400 | $235,000 | $139,400 |
| 2019 | $7,297 | $374,400 | $235,000 | $139,400 |
| 2018 | $7,233 | $374,400 | $235,000 | $139,400 |
| 2017 | $7,091 | $374,400 | $235,000 | $139,400 |
| 2016 | $6,941 | $374,400 | $235,000 | $139,400 |
| 2015 | $7,599 | $257,600 | $147,700 | $109,900 |
| 2014 | $7,493 | $259,800 | $149,900 | $109,900 |
Source: Public Records
Map
Nearby Homes
- 1590 Holly Blvd
- 1551 Holly Blvd
- 2338 Ramshorn Dr
- 737 Paramount Way
- 2531 River Rd
- 2528 River Rd
- 2412 Greentree Dr
- 713 Merrimac Way
- 1544 Harvest Ln
- 1412 Winesap Dr
- 2511 Morningstar Rd
- 814 Bristol Ln
- 677 Overlook Ct
- 2378 Orchard Crest Blvd
- 604 Winding River Rd
- 1422 Lakewood Rd
- 581 Winding River Rd
- 726 Tall Oaks Dr
- 789 Holly Berry Ln
- 2573 Curriers Place
- 2401 Beech St
- 2403 Beech St
- 2401 Cypress St
- 2404 Cypress St
- 2403 Cypress St
- 2405 Beech St
- 2405 Cypress St
- 1616 Myrtle Ave
- 2398 Cypress St
- 2399 Cypress St
- 2400 Cedar St
- 1613 Myrtle Ave
- 2402 Beech St
- 2402 Cedar St
- 2407 Cypress St
- 2406 Cypress St
- 1622 Myrtle Ave
- 2404 Beech St
- 2398 Beech St
- 2406 Cedar St