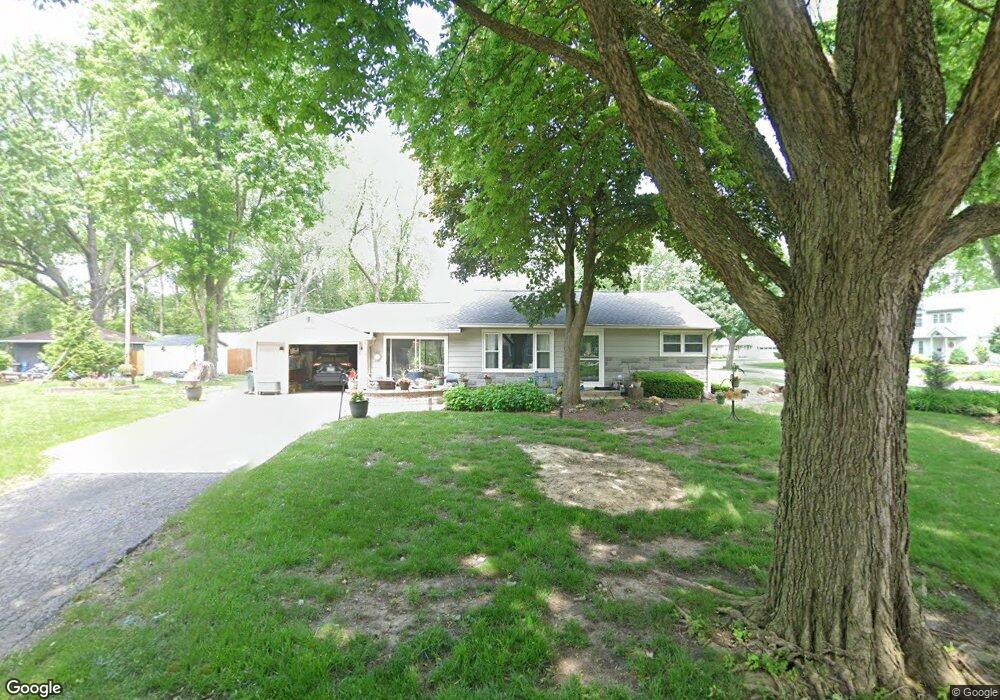
2400 George St Rolling Meadows, IL 60008
Estimated Value: $283,000 - $332,000
2
Beds
1
Bath
1,077
Sq Ft
$295/Sq Ft
Est. Value
About This Home
This home is located at 2400 George St, Rolling Meadows, IL 60008 and is currently estimated at $318,165, approximately $295 per square foot. 2400 George St is a home located in Cook County with nearby schools including Kimball Hill Elementary School, Carl Sandburg Junior High School, and Rolling Meadows High School.
Ownership History
Date
Name
Owned For
Owner Type
Purchase Details
Closed on
Dec 7, 2007
Sold by
Theodosakis Michael J and Theodosakis Erin
Bought by
Pacay Jolinda A
Current Estimated Value
Purchase Details
Closed on
Aug 17, 1998
Sold by
Townsend Trevor R and Reid Sandra R
Bought by
Theodosakis Michael J
Home Financials for this Owner
Home Financials are based on the most recent Mortgage that was taken out on this home.
Original Mortgage
$106,000
Interest Rate
6.99%
Purchase Details
Closed on
Jun 21, 1994
Sold by
Shirmer Christopher W and Kallas Kim
Bought by
Townsend Trevor R and Reid Sandra J
Home Financials for this Owner
Home Financials are based on the most recent Mortgage that was taken out on this home.
Original Mortgage
$103,500
Interest Rate
8.66%
Create a Home Valuation Report for This Property
The Home Valuation Report is an in-depth analysis detailing your home's value as well as a comparison with similar homes in the area
Home Values in the Area
Average Home Value in this Area
Purchase History
| Date | Buyer | Sale Price | Title Company |
|---|---|---|---|
| Pacay Jolinda A | $240,000 | None Available | |
| Theodosakis Michael J | $132,500 | Lawyers Title Insurance Corp | |
| Townsend Trevor R | $123,500 | Attorneys Title Guaranty Fun |
Source: Public Records
Mortgage History
| Date | Status | Borrower | Loan Amount |
|---|---|---|---|
| Previous Owner | Theodosakis Michael J | $106,000 | |
| Previous Owner | Townsend Trevor R | $103,500 |
Source: Public Records
Tax History
| Year | Tax Paid | Tax Assessment Tax Assessment Total Assessment is a certain percentage of the fair market value that is determined by local assessors to be the total taxable value of land and additions on the property. | Land | Improvement |
|---|---|---|---|---|
| 2025 | $6,646 | $28,000 | $7,780 | $20,220 |
| 2024 | $6,646 | $25,000 | $6,583 | $18,417 |
| 2023 | $6,334 | $25,000 | $6,583 | $18,417 |
| 2022 | $6,334 | $25,000 | $6,583 | $18,417 |
| 2021 | $5,496 | $19,926 | $3,889 | $16,037 |
| 2020 | $5,440 | $19,926 | $3,889 | $16,037 |
| 2019 | $5,480 | $22,264 | $3,889 | $18,375 |
| 2018 | $5,457 | $20,282 | $3,590 | $16,692 |
| 2017 | $5,365 | $20,282 | $3,590 | $16,692 |
| 2016 | $5,257 | $20,282 | $3,590 | $16,692 |
| 2015 | $4,477 | $16,843 | $3,291 | $13,552 |
| 2014 | $4,387 | $16,843 | $3,291 | $13,552 |
| 2013 | $4,264 | $16,843 | $3,291 | $13,552 |
Source: Public Records
Map
Nearby Homes
- 2705 Park St
- 2709 Lily Ln
- 2201 Kingfisher Ln
- 3209 Trillium Cir
- 3306 Trillium Cir Unit 3001
- 3314 Trillium Cir
- 3100 Town Square Dr Unit 308
- 3100 Town Square Dr Unit 204
- 3135 Town Square Dr Unit 401
- 3135 Town Square Dr Unit 104
- 2814 Cardinal Dr
- 3605 Oriole Ln
- 3265 Kirchoff Rd Unit 116
- 3712 Jay Ln
- 3200 Thrush Ln
- 3345 Kirchoff Rd Unit 5C
- 2302 Flicker Ln
- 27 S Kaspar Ave
- 2302 Fulle St
- 2401 Rohlwing Rd
- 2705 Oriole Ln
- 2402 George St
- 2401 George St
- 2703 Oriole Ln
- 2404 George St
- 2310 George St
- 2403 George St
- 2704 Oriole Ln
- 2803 Oriole Ln
- 2403 Sigwalt St
- 2406 George St
- 2405 George St
- 2311 George St
- 2401 Sigwalt St
- 2702 Oriole Ln
- 2405 Sigwalt St
- 2407 George St
- 2308 George St
- 2408 George St
- 2802 Oriole Ln
Your Personal Tour Guide
Ask me questions while you tour the home.