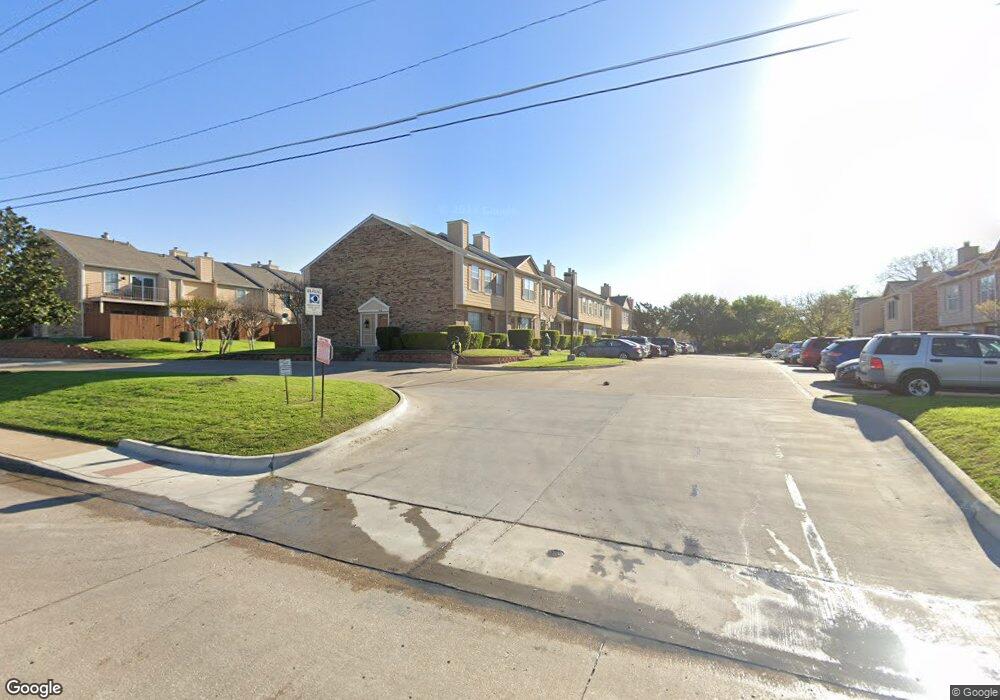
2400 Jupiter Rd Unit 2 Plano, TX 75074
Armstrong Park NeighborhoodEstimated Value: $190,027 - $220,000
--
Bed
--
Bath
929
Sq Ft
$219/Sq Ft
Est. Value
About This Home
This home is located at 2400 Jupiter Rd Unit 2, Plano, TX 75074 and is currently estimated at $203,257, approximately $218 per square foot. 2400 Jupiter Rd Unit 2 is a home located in Collin County with nearby schools including Meadows Elementary School, Armstrong Middle School, and Plano East Sr High School.
Ownership History
Date
Name
Owned For
Owner Type
Purchase Details
Closed on
Apr 20, 2006
Sold by
Poon Kwok T
Bought by
Rodriguez Angel and Rodriguez Consuelo
Current Estimated Value
Home Financials for this Owner
Home Financials are based on the most recent Mortgage that was taken out on this home.
Original Mortgage
$49,600
Outstanding Balance
$28,733
Interest Rate
6.5%
Mortgage Type
Fannie Mae Freddie Mac
Estimated Equity
$174,524
Purchase Details
Closed on
Nov 17, 2004
Sold by
Hoops Linda R
Bought by
Poon Kwok T
Home Financials for this Owner
Home Financials are based on the most recent Mortgage that was taken out on this home.
Original Mortgage
$46,800
Interest Rate
5.72%
Mortgage Type
Purchase Money Mortgage
Purchase Details
Closed on
Feb 17, 1997
Sold by
Banack Helen M
Bought by
Hoops Linda R
Home Financials for this Owner
Home Financials are based on the most recent Mortgage that was taken out on this home.
Original Mortgage
$48,307
Interest Rate
7.85%
Mortgage Type
VA
Create a Home Valuation Report for This Property
The Home Valuation Report is an in-depth analysis detailing your home's value as well as a comparison with similar homes in the area
Home Values in the Area
Average Home Value in this Area
Purchase History
| Date | Buyer | Sale Price | Title Company |
|---|---|---|---|
| Rodriguez Angel | -- | Ctic | |
| Poon Kwok T | -- | Ctic | |
| Hoops Linda R | -- | -- |
Source: Public Records
Mortgage History
| Date | Status | Borrower | Loan Amount |
|---|---|---|---|
| Open | Rodriguez Angel | $49,600 | |
| Previous Owner | Poon Kwok T | $46,800 | |
| Previous Owner | Hoops Linda R | $48,307 |
Source: Public Records
Tax History Compared to Growth
Tax History
| Year | Tax Paid | Tax Assessment Tax Assessment Total Assessment is a certain percentage of the fair market value that is determined by local assessors to be the total taxable value of land and additions on the property. | Land | Improvement |
|---|---|---|---|---|
| 2025 | $3,194 | $182,653 | $44,000 | $138,653 |
| 2024 | $3,194 | $188,918 | $44,000 | $144,918 |
| 2023 | $3,194 | $171,160 | $44,000 | $127,160 |
| 2022 | $3,152 | $164,918 | $44,000 | $120,918 |
| 2021 | $2,666 | $132,205 | $40,000 | $92,205 |
| 2020 | $2,689 | $131,692 | $40,000 | $91,692 |
| 2019 | $2,868 | $132,699 | $30,000 | $102,699 |
| 2018 | $2,107 | $96,657 | $25,000 | $71,657 |
| 2017 | $1,848 | $84,799 | $18,000 | $66,799 |
| 2016 | $1,779 | $80,580 | $5,520 | $75,060 |
| 2015 | $1,410 | $67,532 | $5,520 | $62,012 |
Source: Public Records
Map
Nearby Homes
- 2412 Briarwood Dr
- 2500 E Park Blvd Unit W5
- 2500 E Park Blvd Unit U3
- 2500 E Park Blvd Unit Q1
- 2500 E Park Blvd Unit U9
- 2605 Natalie Dr
- 2405 Raintree Dr
- 2020 Rigsbee Dr
- 2308 Richmond Dr
- 2608 Figtree Ln
- 2717 E Park Blvd
- 2712 Raintree Dr
- 2912 Brookview Dr
- 2908 E Park Blvd
- 2813 Raintree Dr
- 2313 Forestcrest Dr
- 2904 Raintree Dr
- 2917 Dale Dr
- 2404 17th St
- 1716 Armstrong Dr
- 2400 Jupiter Rd Unit J1
- 2400 Jupiter Rd Unit A3
- 2400 Jupiter Rd Unit I1
- 2400 Jupiter Rd Unit I6
- 2400 Jupiter Rd Unit A6
- 2400 Jupiter Rd Unit E4
- 2400 Jupiter Rd Unit 4
- 2400 Jupiter Rd Unit 4
- 2400 Jupiter Rd Unit 5
- 2400 Jupiter Rd Unit 7
- 2400 Jupiter Rd Unit 5
- 2400 Jupiter Rd Unit 6
- 2400 Jupiter Rd Unit 8
- 2400 Jupiter Rd Unit 2
- 2400 Jupiter Rd Unit 3
- 2400 Jupiter Rd Unit 4
- 2400 Jupiter Rd Unit 6
- 2400 Jupiter Rd Unit 8
- 2400 Jupiter Rd Unit 2
- 2400 Jupiter Rd Unit 1