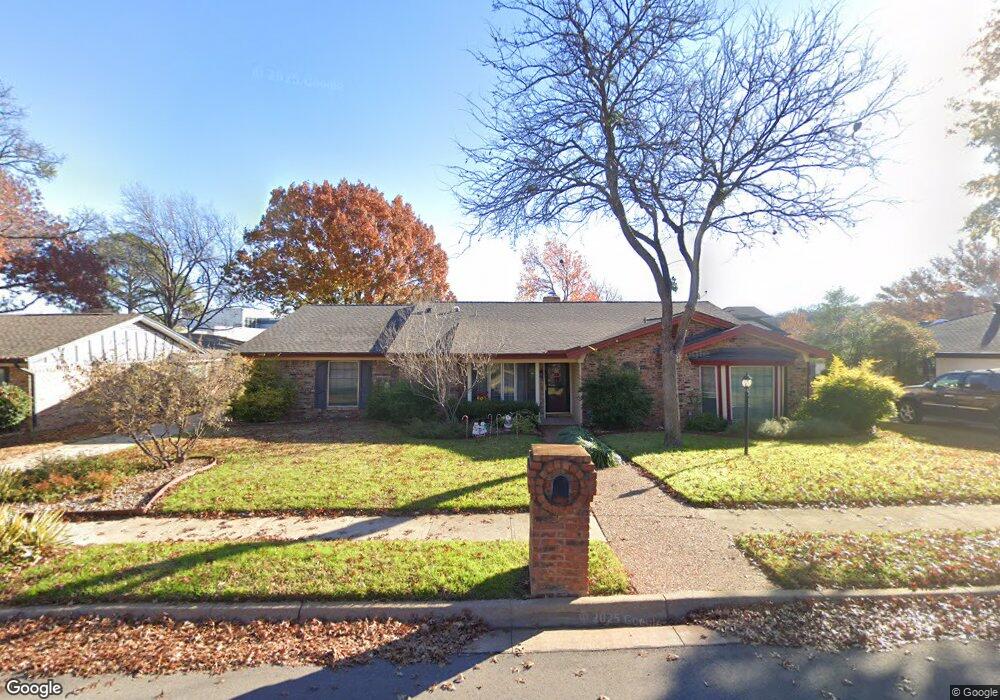
2400 Lakeview Dr Bedford, TX 76021
Estimated Value: $401,000 - $494,000
3
Beds
2
Baths
2,573
Sq Ft
$172/Sq Ft
Est. Value
About This Home
This home is located at 2400 Lakeview Dr, Bedford, TX 76021 and is currently estimated at $442,310, approximately $171 per square foot. 2400 Lakeview Dr is a home located in Tarrant County with nearby schools including Shady Brook Elementary School, Bedford Junior High School, and L.D. Bell High School.
Ownership History
Date
Name
Owned For
Owner Type
Purchase Details
Closed on
Jan 28, 2013
Sold by
Wethington Elizabeth Ann Case
Bought by
Wethington Elizabeth Ann Case and Elizabeth Ann Case Wethington Trust
Current Estimated Value
Purchase Details
Closed on
Sep 12, 2007
Sold by
Wethington William Joseph and Wethington Elizabeth Ann Case
Bought by
Wethington William Joseph and Wethington Elizabeth Ann Case
Purchase Details
Closed on
Apr 20, 2005
Sold by
Wethington William Joseph and Wethington Elizabeth Ann Case
Bought by
Wethington William Joseph and Wethington Elizabeth Ann Case
Home Financials for this Owner
Home Financials are based on the most recent Mortgage that was taken out on this home.
Original Mortgage
$258,948
Interest Rate
4.82%
Mortgage Type
FHA
Purchase Details
Closed on
Mar 6, 2003
Sold by
Wethington William J and Wethington Elizabeth A
Bought by
Wethington William Joseph and Wethington Elizabeth Ann Case
Create a Home Valuation Report for This Property
The Home Valuation Report is an in-depth analysis detailing your home's value as well as a comparison with similar homes in the area
Home Values in the Area
Average Home Value in this Area
Purchase History
| Date | Buyer | Sale Price | Title Company |
|---|---|---|---|
| Wethington Elizabeth Ann Case | -- | None Available | |
| Wethington William Joseph | -- | None Available | |
| Wethington William Joseph | -- | Metroplex Title Inc | |
| Wethington William Joseph | -- | -- |
Source: Public Records
Mortgage History
| Date | Status | Borrower | Loan Amount |
|---|---|---|---|
| Closed | Wethington William Joseph | $258,948 | |
| Closed | Wethington William Joseph | $258,948 |
Source: Public Records
Tax History Compared to Growth
Tax History
| Year | Tax Paid | Tax Assessment Tax Assessment Total Assessment is a certain percentage of the fair market value that is determined by local assessors to be the total taxable value of land and additions on the property. | Land | Improvement |
|---|---|---|---|---|
| 2025 | $1,439 | $272,430 | $80,000 | $192,430 |
| 2024 | $1,439 | $334,448 | $80,000 | $254,448 |
| 2023 | $1,494 | $280,086 | $80,000 | $200,086 |
| 2022 | $5,992 | $274,335 | $80,000 | $194,335 |
| 2021 | $6,295 | $267,254 | $80,000 | $187,254 |
| 2020 | $5,944 | $250,000 | $80,000 | $170,000 |
| 2019 | $6,073 | $250,000 | $80,000 | $170,000 |
| 2018 | $2,626 | $250,000 | $80,000 | $170,000 |
| 2017 | $5,715 | $242,183 | $22,000 | $220,183 |
| 2016 | $5,196 | $216,255 | $22,000 | $194,255 |
| 2015 | $2,650 | $195,250 | $22,000 | $173,250 |
| 2014 | $2,650 | $198,200 | $22,000 | $176,200 |
Source: Public Records
Map
Nearby Homes
- 2501 Shady Grove Dr
- 2317 Shady Grove Dr
- 2508 Lakeview Dr
- 2700 Shady Grove Dr
- 2704 Shady Grove Dr
- 2225 Shady Brook Dr
- 1013 Springdale Rd
- 922 Shady Creek Ln
- 2420 Stonegate Dr N
- 49 Morrow Dr
- 2503 Shady Ridge Dr
- 2524 Shady Ridge Dr
- 31 Morrow Dr
- 1401 Danielle Dr
- 801 Shady Creek Ln
- 1601 Warwickshire Ct W
- 817 Shady Lake Dr
- 2901 Miles Way
- 2436 Brookgreen Ct
- 18 Park Ln
- 2404 Lakeview Dr
- 2324 Lakeview Dr
- 2320 Lakeview Dr
- 2408 Lakeview Dr
- 2401 Lakeview Dr
- 2405 Lakeview Dr
- 2325 Lakeview Dr
- 2321 Lakeview Dr
- 2409 Lakeview Dr
- 2316 Lakeview Dr
- 2400 Shady Grove Dr
- 2317 Lakeview Dr
- 2404 Shady Grove Dr
- 2500 Lakeview Dr
- 2324 Shady Grove Dr
- 2312 Lakeview Dr
- 2320 Shady Grove Dr
- 2501 Lakeview Dr
- 2313 Lakeview Dr
- 2504 Lakeview Dr