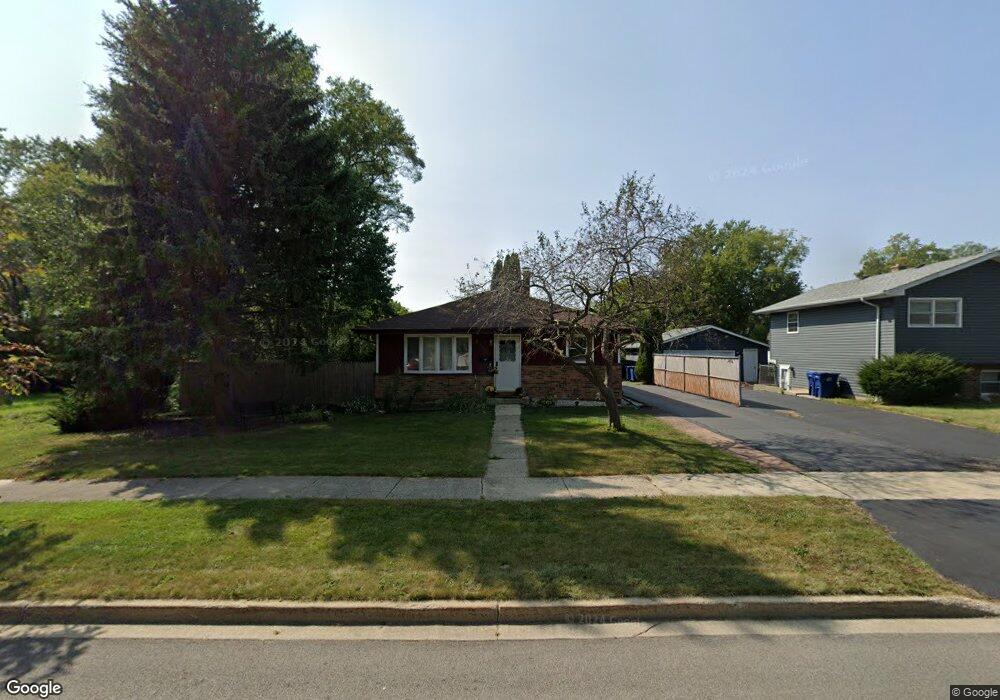
2400 Metropolitan Ave Waukegan, IL 60087
Estimated Value: $261,592 - $287,000
3
Beds
2
Baths
1,260
Sq Ft
$218/Sq Ft
Est. Value
About This Home
This home is located at 2400 Metropolitan Ave, Waukegan, IL 60087 and is currently estimated at $274,898, approximately $218 per square foot. 2400 Metropolitan Ave is a home located in Lake County with nearby schools including Oakdale Elementary School, Jack Benny Middle School, and Waukegan High School.
Ownership History
Date
Name
Owned For
Owner Type
Purchase Details
Closed on
Mar 20, 2018
Sold by
Melgoza Paloma and Estate Of Marta Gonzalez De Me
Bought by
Melgoza Paloma and Melgoza Rosa
Current Estimated Value
Purchase Details
Closed on
May 12, 2005
Sold by
Melgoza Maribel
Bought by
Gonzalez Marta
Purchase Details
Closed on
Jan 29, 2001
Sold by
Melgoza Carlos
Bought by
Melgoza Maribel
Home Financials for this Owner
Home Financials are based on the most recent Mortgage that was taken out on this home.
Original Mortgage
$112,800
Interest Rate
7.22%
Purchase Details
Closed on
Dec 28, 1993
Sold by
Wagner Jack and Wagner Kathryn A
Bought by
Melgoza Carlos and Gonzalez Marta
Home Financials for this Owner
Home Financials are based on the most recent Mortgage that was taken out on this home.
Original Mortgage
$117,894
Interest Rate
8.34%
Mortgage Type
FHA
Create a Home Valuation Report for This Property
The Home Valuation Report is an in-depth analysis detailing your home's value as well as a comparison with similar homes in the area
Home Values in the Area
Average Home Value in this Area
Purchase History
| Date | Buyer | Sale Price | Title Company |
|---|---|---|---|
| Melgoza Paloma | -- | None Available | |
| Gonzalez Marta | -- | -- | |
| Melgoza Maribel | -- | -- | |
| Melgoza Carlos | $119,000 | -- |
Source: Public Records
Mortgage History
| Date | Status | Borrower | Loan Amount |
|---|---|---|---|
| Previous Owner | Melgoza Maribel | $112,800 | |
| Previous Owner | Melgoza Carlos | $117,894 |
Source: Public Records
Tax History Compared to Growth
Tax History
| Year | Tax Paid | Tax Assessment Tax Assessment Total Assessment is a certain percentage of the fair market value that is determined by local assessors to be the total taxable value of land and additions on the property. | Land | Improvement |
|---|---|---|---|---|
| 2024 | $5,075 | $69,046 | $12,669 | $56,377 |
| 2023 | $5,426 | $61,818 | $11,343 | $50,475 |
| 2022 | $5,426 | $61,507 | $11,443 | $50,064 |
| 2021 | $5,115 | $55,058 | $10,206 | $44,852 |
| 2020 | $5,134 | $51,293 | $9,508 | $41,785 |
| 2019 | $5,115 | $47,002 | $8,713 | $38,289 |
| 2018 | $4,610 | $45,735 | $11,270 | $34,465 |
| 2017 | $2,288 | $40,463 | $9,971 | $30,492 |
| 2016 | $2,485 | $32,556 | $8,022 | $24,534 |
| 2015 | $2,717 | $29,138 | $7,180 | $21,958 |
| 2014 | $2,864 | $27,082 | $6,842 | $20,240 |
| 2012 | $4,110 | $29,342 | $7,414 | $21,928 |
Source: Public Records
Map
Nearby Homes
- 2713 Varonen Ave
- 2705 Dana Ave
- 2708 Dana Ave
- 3032 W Vermont Ave
- 36955 N Garrick Ave
- 3320 Sunset Ave
- 12312 W Audrey Ave
- 2928 W Country Club Ave
- 3000 W Country Club Ave
- 2946 W Country Club Ave
- 36245 N Green Bay Rd
- 1913 Chippewa Rd
- 2715 W Greenwood Ave
- 2440 W Cheyenne Rd
- 2350 N Lewis Ave
- 12535 W Blanchard Rd
- 2613 N Lewis Ave
- 12933 W Polo Ave
- 3101 Country Club Ln
- 2810 W Atlantic Ave
- 2402 Metropolitan Ave
- 2408 Metropolitan Ave
- 2732 W Vermont Ave
- 2321 Seminole Rd
- 2325 Seminole Rd
- 2805 W Nemesis Ave
- 2412 Metropolitan Ave
- 2745 W Vermont Ave
- 2808 Shoshone Rd
- 2405 Metropolitan Ave
- 2728 W Vermont Ave
- 2317 Seminole Rd Unit 3
- 2409 Metropolitan Ave
- 2819 W Nemesis Ave
- 2812 Shoshone Rd
- 2741 W Vermont Ave
- 2413 N Metropolitan Ave
- 2413 Metropolitan Ave
- 2737 Varonen Ave
- 2816 Shoshone Rd