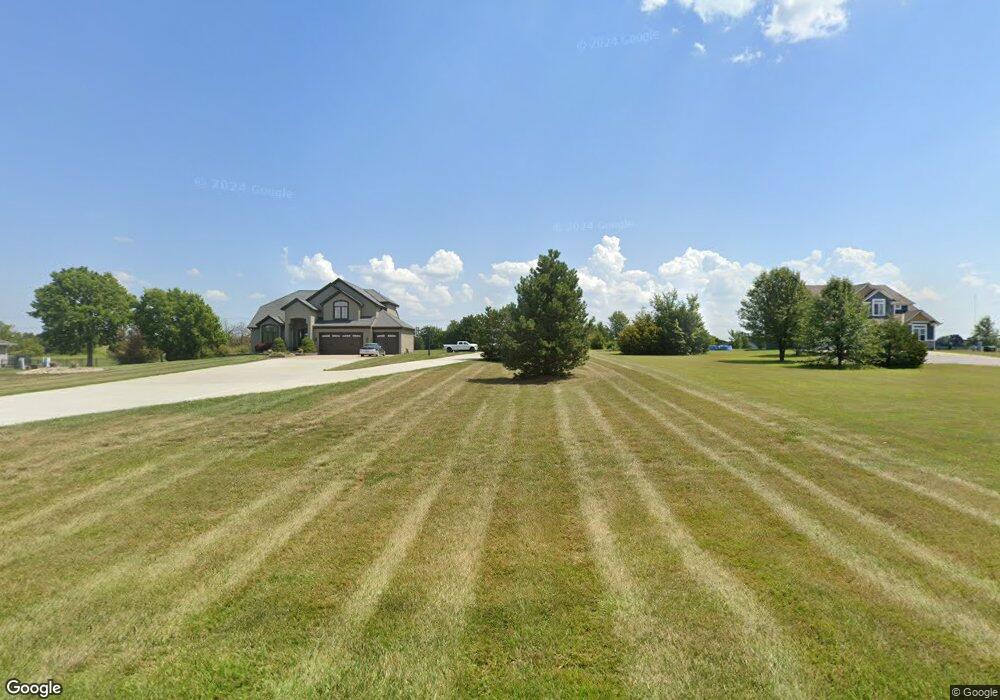
24005 S Lucille Ln Peculiar, MO 64078
Estimated Value: $510,000 - $798,000
4
Beds
4
Baths
3,600
Sq Ft
$175/Sq Ft
Est. Value
About This Home
This home is located at 24005 S Lucille Ln, Peculiar, MO 64078 and is currently estimated at $631,409, approximately $175 per square foot. 24005 S Lucille Ln is a home located in Cass County with nearby schools including Peculiar Elementary School, Raymore-Peculiar South Middle School, and Raymore-Peculiar Senior High School.
Ownership History
Date
Name
Owned For
Owner Type
Purchase Details
Closed on
Dec 31, 2008
Sold by
Aqulia Inc
Bought by
Lampkin Grey J and Lampkin Carleigh M
Current Estimated Value
Home Financials for this Owner
Home Financials are based on the most recent Mortgage that was taken out on this home.
Original Mortgage
$275,973
Outstanding Balance
$180,348
Interest Rate
5.99%
Mortgage Type
FHA
Estimated Equity
$451,061
Purchase Details
Closed on
Sep 18, 2008
Sold by
Thomson Eric B
Bought by
Aquila Inc and Kcp&L Greater Missouri Operations Co
Purchase Details
Closed on
Feb 2, 2007
Sold by
Clark Debra A and Thomson Debra A
Bought by
Thomson Eric B
Create a Home Valuation Report for This Property
The Home Valuation Report is an in-depth analysis detailing your home's value as well as a comparison with similar homes in the area
Home Values in the Area
Average Home Value in this Area
Purchase History
| Date | Buyer | Sale Price | Title Company |
|---|---|---|---|
| Lampkin Grey J | -- | Kansas City Title | |
| Aquila Inc | -- | -- | |
| Thomson Eric B | -- | -- |
Source: Public Records
Mortgage History
| Date | Status | Borrower | Loan Amount |
|---|---|---|---|
| Open | Lampkin Grey J | $275,973 |
Source: Public Records
Tax History
| Year | Tax Paid | Tax Assessment Tax Assessment Total Assessment is a certain percentage of the fair market value that is determined by local assessors to be the total taxable value of land and additions on the property. | Land | Improvement |
|---|---|---|---|---|
| 2025 | $4,400 | $71,190 | $7,510 | $63,680 |
| 2024 | $4,400 | $62,900 | $6,830 | $56,070 |
| 2023 | $4,409 | $62,900 | $6,830 | $56,070 |
| 2022 | $3,970 | $55,540 | $6,830 | $48,710 |
| 2021 | $3,958 | $55,540 | $6,830 | $48,710 |
| 2020 | $3,970 | $54,230 | $6,830 | $47,400 |
| 2019 | $3,913 | $54,230 | $6,830 | $47,400 |
| 2018 | $3,584 | $48,230 | $5,460 | $42,770 |
| 2017 | $3,336 | $48,230 | $5,460 | $42,770 |
| 2016 | $3,336 | $46,010 | $5,460 | $40,550 |
| 2015 | $2,911 | $40,220 | $5,460 | $34,760 |
| 2014 | $2,823 | $40,610 | $5,460 | $35,150 |
| 2013 | -- | $40,610 | $5,460 | $35,150 |
Source: Public Records
Map
Nearby Homes
- 0 E 235th St Unit HMS2543171
- 23313 S Aero Dr
- 000 Twin Oaks Pkwy
- TBD W 1st St
- TBD N Main St
- 11805 E Ridgeview Ct
- 11800 E 231st St
- 11802 E 231st St
- 11804 E 231st St
- 11808 E 231st St
- 12301 E 233rd St
- 11717 E 231st St
- 11207 Trevor Dr
- 11112 E 227th St
- 11407 Trevor Dr
- 11406 Trevor Dr
- 7409 E 229th St
- 22617 Vincent St
- 22624 Vincent St
- 22620 Vincent St
- 23925 S Lucille Ln
- 24011 S Lucille Ln
- 24021 S Lucille Ln
- 23915 S Lucille Ln
- 24004 S Lucille Ln
- 23920 S Lucille Ln
- 24012 S Lucille Ln
- 24020 S Lucille Ln
- 23910 S Lucille Ln
- 23907 S Lucille Ln
- 9902 E 241st St
- 23904 S Lucille Ln
- 23817 S Lucille Ln
- 23816 S Lucille Ln
- 9804 E 241st St
- 23811 S Lucille Ln
- 23812 S Lucille Ln
- 9801 E 241st St
- 9812 E 241st St
- 23805 S Lucille Ln
Your Personal Tour Guide
Ask me questions while you tour the home.