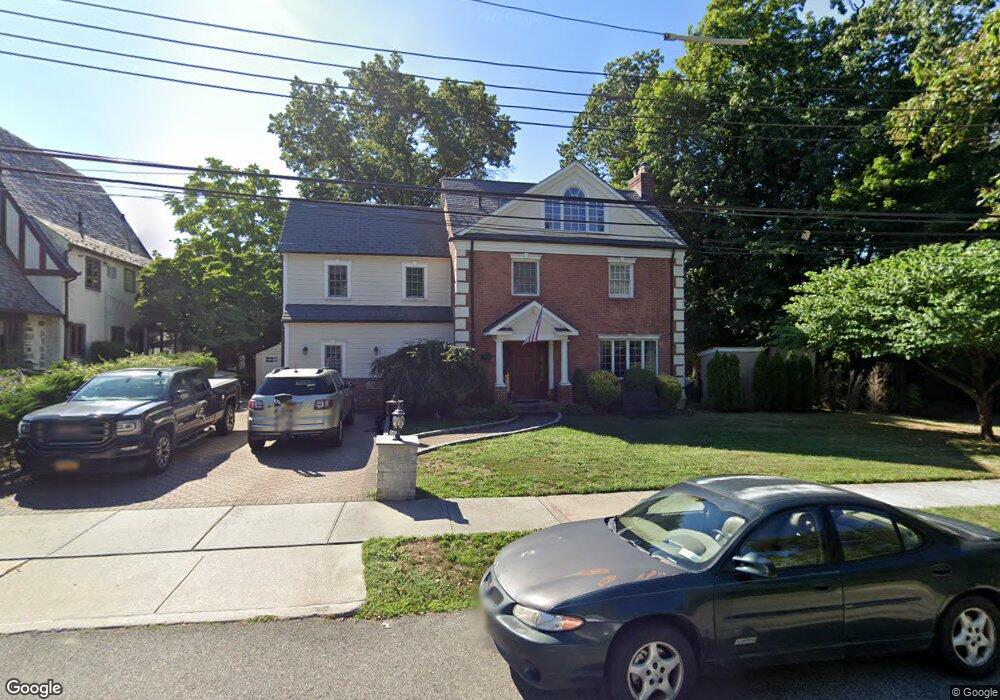
24006 53rd Ave Little Neck, NY 11362
Douglaston NeighborhoodEstimated Value: $1,389,000 - $1,615,794
--
Bed
--
Bath
2,856
Sq Ft
$524/Sq Ft
Est. Value
About This Home
This home is located at 24006 53rd Ave, Little Neck, NY 11362 and is currently estimated at $1,496,699, approximately $524 per square foot. 24006 53rd Ave is a home located in Queens County with nearby schools including P.S. 098 The Douglaston School, Louis Pasteur Middle School 67, and Benjamin N Cardozo High School.
Ownership History
Date
Name
Owned For
Owner Type
Purchase Details
Closed on
Feb 25, 2025
Sold by
Lemer Lenny
Bought by
Gao Yuan Christina and Kong Calvin Bong
Current Estimated Value
Home Financials for this Owner
Home Financials are based on the most recent Mortgage that was taken out on this home.
Original Mortgage
$730,000
Outstanding Balance
$726,385
Interest Rate
7.04%
Mortgage Type
Purchase Money Mortgage
Estimated Equity
$770,314
Purchase Details
Closed on
Feb 25, 1996
Sold by
Winfield Jeffrey S and Winfield Susan K
Bought by
Stefan Waldi A and Stefan Diana L
Home Financials for this Owner
Home Financials are based on the most recent Mortgage that was taken out on this home.
Original Mortgage
$215,000
Interest Rate
6.9%
Create a Home Valuation Report for This Property
The Home Valuation Report is an in-depth analysis detailing your home's value as well as a comparison with similar homes in the area
Home Values in the Area
Average Home Value in this Area
Purchase History
| Date | Buyer | Sale Price | Title Company |
|---|---|---|---|
| Gao Yuan Christina | $1,430,000 | -- | |
| Stefan Waldi A | $320,000 | Ticor Title Guarantee Compan | |
| Stefan Waldi A | $320,000 | Ticor Title Guarantee Compan |
Source: Public Records
Mortgage History
| Date | Status | Borrower | Loan Amount |
|---|---|---|---|
| Open | Gao Yuan Christina | $730,000 | |
| Previous Owner | Stefan Waldi A | $215,000 |
Source: Public Records
Tax History Compared to Growth
Tax History
| Year | Tax Paid | Tax Assessment Tax Assessment Total Assessment is a certain percentage of the fair market value that is determined by local assessors to be the total taxable value of land and additions on the property. | Land | Improvement |
|---|---|---|---|---|
| 2025 | $17,216 | $91,106 | $18,747 | $72,359 |
| 2024 | $17,229 | $87,118 | $18,756 | $68,362 |
| 2023 | $16,526 | $83,680 | $17,990 | $65,690 |
| 2022 | $16,318 | $101,520 | $21,000 | $80,520 |
| 2021 | $16,423 | $95,940 | $21,000 | $74,940 |
| 2020 | $15,774 | $94,140 | $21,000 | $73,140 |
| 2019 | $14,894 | $92,100 | $21,000 | $71,100 |
| 2018 | $13,917 | $69,733 | $17,789 | $51,944 |
| 2017 | $13,830 | $69,316 | $19,377 | $49,939 |
| 2016 | $12,925 | $69,316 | $19,377 | $49,939 |
| 2015 | $7,667 | $63,268 | $20,108 | $43,160 |
| 2014 | $7,667 | $60,499 | $19,228 | $41,271 |
Source: Public Records
Map
Nearby Homes
- 53-21 240th St
- 52-04 Redfield St
- 242-52 Horace Harding Expy Unit 2
- 242-52 Horace Harding Expy Unit A
- 5211 Redfield St
- 56- 10 244th St Unit 1
- 62-01 Douglaston Pkwy Unit 1
- 57-54 244th St Unit Lower Unit
- 6227 Douglaston Pkwy Unit 13
- 244-02 57th Dr Unit E-6
- 57-55 244th St Unit 7F (1st Floor)
- 244-16 57th Dr Unit 2nd Floor
- 244-25 57th Dr Unit 6G
- 57-21 246th Crescent Unit B2-7 Upper
- 57-21 246th Crescent Unit 1FL
- 50-15 245th St
- 245-84 62 Ave Unit B1-1
- 5022 Overbrook St
- 240-02 65th Ave
- 57-47 246th Crescent Unit 1