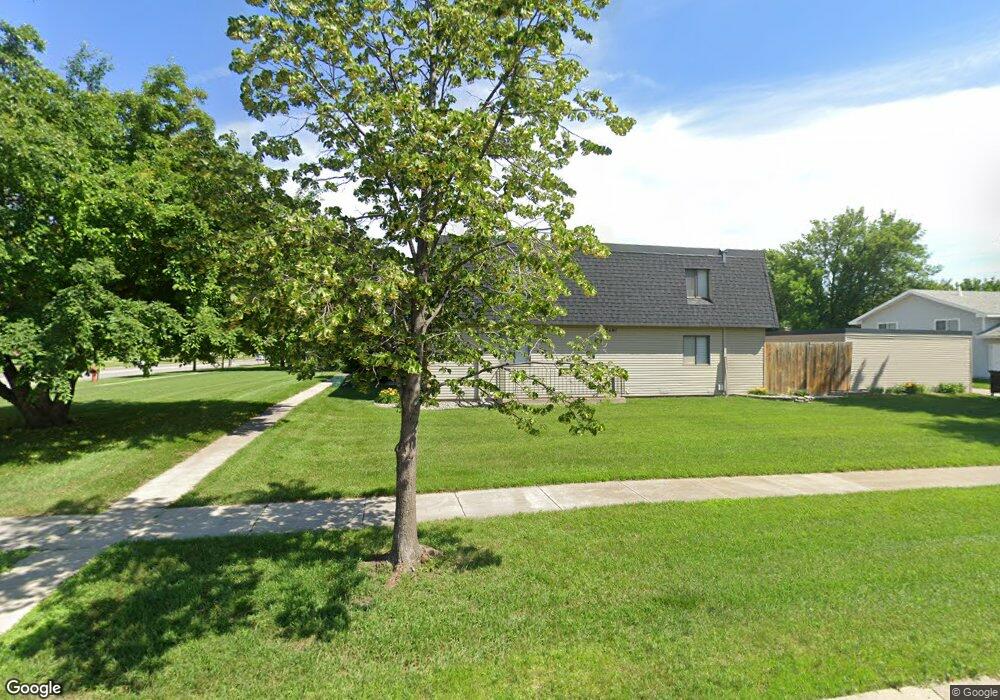
2401 16th Ave S Unit 12 Fargo, ND 58103
South High NeighborhoodEstimated Value: $126,000 - $130,000
2
Beds
1
Bath
924
Sq Ft
$138/Sq Ft
Est. Value
About This Home
This home is located at 2401 16th Ave S Unit 12, Fargo, ND 58103 and is currently estimated at $127,866, approximately $138 per square foot. 2401 16th Ave S Unit 12 is a home located in Cass County with nearby schools including Lewis & Clark Elementary School, Carl Ben Eielson Middle School, and South High School.
Ownership History
Date
Name
Owned For
Owner Type
Purchase Details
Closed on
Mar 31, 2021
Sold by
Burns Elaine B
Bought by
Burns Elaine B and Klein Amy
Current Estimated Value
Purchase Details
Closed on
Oct 1, 2018
Sold by
Guan Zhimin and Qian Vivian
Bought by
Burns Elaine B
Purchase Details
Closed on
Aug 21, 2015
Sold by
Gudding Mila Z
Bought by
Guan Zhimin and Qian Vivian
Home Financials for this Owner
Home Financials are based on the most recent Mortgage that was taken out on this home.
Original Mortgage
$65,100
Interest Rate
4.03%
Mortgage Type
New Conventional
Purchase Details
Closed on
Jan 30, 2010
Sold by
Fradet Mark S
Bought by
Gudding Mila Z
Home Financials for this Owner
Home Financials are based on the most recent Mortgage that was taken out on this home.
Original Mortgage
$62,320
Interest Rate
5.02%
Mortgage Type
New Conventional
Create a Home Valuation Report for This Property
The Home Valuation Report is an in-depth analysis detailing your home's value as well as a comparison with similar homes in the area
Home Values in the Area
Average Home Value in this Area
Purchase History
| Date | Buyer | Sale Price | Title Company |
|---|---|---|---|
| Burns Elaine B | -- | None Available | |
| Burns Elaine B | $95,000 | None Available | |
| Guan Zhimin | $93,000 | None Available | |
| Gudding Mila Z | -- | -- |
Source: Public Records
Mortgage History
| Date | Status | Borrower | Loan Amount |
|---|---|---|---|
| Previous Owner | Guan Zhimin | $65,100 | |
| Previous Owner | Gudding Mila Z | $62,320 |
Source: Public Records
Tax History Compared to Growth
Tax History
| Year | Tax Paid | Tax Assessment Tax Assessment Total Assessment is a certain percentage of the fair market value that is determined by local assessors to be the total taxable value of land and additions on the property. | Land | Improvement |
|---|---|---|---|---|
| 2024 | $1,454 | $51,700 | $6,000 | $45,700 |
| 2023 | $1,368 | $48,750 | $6,000 | $42,750 |
| 2022 | $1,304 | $45,550 | $6,000 | $39,550 |
| 2021 | $1,373 | $49,000 | $8,500 | $40,500 |
| 2020 | $1,272 | $45,800 | $8,500 | $37,300 |
| 2019 | $1,195 | $42,800 | $5,300 | $37,500 |
| 2018 | $1,180 | $42,800 | $5,300 | $37,500 |
| 2017 | $1,136 | $41,550 | $5,300 | $36,250 |
| 2016 | $1,005 | $40,350 | $5,300 | $35,050 |
| 2015 | $47 | $36,650 | $3,600 | $33,050 |
| 2014 | $47 | $33,300 | $3,600 | $29,700 |
| 2013 | $16 | $33,300 | $3,600 | $29,700 |
Source: Public Records
Map
Nearby Homes
- 2402 N Flickertail Dr S Unit 1
- 2202 15th Ave S
- 1725 Whitestone Cir S
- 1402 E Gateway Cir S Unit M
- 1737 Park Blvd S
- 2013 13th Ave S
- 2009 13th Ave S
- 21 Birch Ln S
- 1407 17th St S
- 1129 22nd St S Unit B09
- 1129 22nd St S Unit B12
- 2326 20th Ave S Unit 9
- 2320 20th Ave S Unit 7
- 1709 13th Ave S
- 3237 17th Ave S Unit 101
- 1943 19th St S
- 1301 16 1 2 St S
- 3249 16th Ave S Unit 4
- 3305 15th Ave S Unit B
- 3250 15th Ave S Unit 2
- 2401 16th Ave S Unit 13
- 2401 16th Ave S Unit 16
- 2401 16th Ave S Unit 15
- 2401 16th Ave S Unit 14
- 2401 16th Ave S Unit 11
- 2401 16th Ave S Unit 10
- 2401 16th Ave S Unit 9
- 2401 16th Ave S
- 2307 16th Ave S
- 3200 16th Ave S
- 1539 23rd St S
- 2301 16th Ave S
- 2408 16th Ave S
- 2402 16th Ave S
- 1533 23rd St S
- 2308 16th Ave S
- 2402 N Flickertail Dr S Unit S
- 2402 N Flickertail Dr S Unit S
- 2402 N Flickertail Dr S Unit S
- 2402 N Flickertail Dr S Unit S