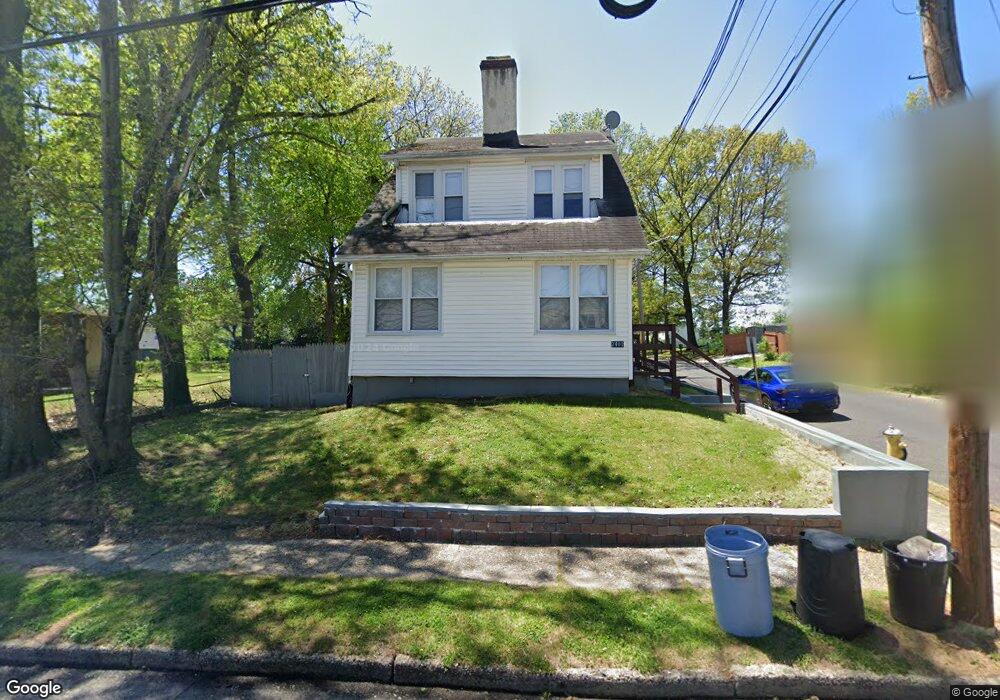
2401 46th St Pennsauken, NJ 08110
Estimated Value: $241,977 - $347,000
--
Bed
--
Bath
1,594
Sq Ft
$192/Sq Ft
Est. Value
About This Home
This home is located at 2401 46th St, Pennsauken, NJ 08110 and is currently estimated at $306,244, approximately $192 per square foot. 2401 46th St is a home located in Camden County with nearby schools including Pennsauken High School, St. Peter Elementary School, and St. Cecilia School.
Ownership History
Date
Name
Owned For
Owner Type
Purchase Details
Closed on
Feb 25, 2003
Sold by
Us Bank National Assoc
Bought by
Bilu Sandra Lee
Current Estimated Value
Home Financials for this Owner
Home Financials are based on the most recent Mortgage that was taken out on this home.
Original Mortgage
$61,600
Interest Rate
5.64%
Purchase Details
Closed on
Mar 8, 1994
Sold by
Moffa James
Bought by
Hooks Henry L
Home Financials for this Owner
Home Financials are based on the most recent Mortgage that was taken out on this home.
Original Mortgage
$84,000
Interest Rate
8.22%
Create a Home Valuation Report for This Property
The Home Valuation Report is an in-depth analysis detailing your home's value as well as a comparison with similar homes in the area
Home Values in the Area
Average Home Value in this Area
Purchase History
| Date | Buyer | Sale Price | Title Company |
|---|---|---|---|
| Bilu Sandra Lee | $77,000 | -- | |
| Hooks Henry L | $104,900 | -- |
Source: Public Records
Mortgage History
| Date | Status | Borrower | Loan Amount |
|---|---|---|---|
| Previous Owner | Bilu Sandra Lee | $61,600 | |
| Previous Owner | Hooks Henry L | $84,000 |
Source: Public Records
Tax History Compared to Growth
Tax History
| Year | Tax Paid | Tax Assessment Tax Assessment Total Assessment is a certain percentage of the fair market value that is determined by local assessors to be the total taxable value of land and additions on the property. | Land | Improvement |
|---|---|---|---|---|
| 2025 | $5,497 | $228,600 | $55,700 | $172,900 |
| 2024 | $5,390 | $126,300 | $35,200 | $91,100 |
| 2023 | $5,390 | $126,300 | $35,200 | $91,100 |
| 2022 | $4,874 | $126,300 | $35,200 | $91,100 |
| 2021 | $5,005 | $126,300 | $35,200 | $91,100 |
| 2020 | $4,484 | $126,300 | $35,200 | $91,100 |
| 2019 | $4,535 | $126,300 | $35,200 | $91,100 |
| 2018 | $4,559 | $126,300 | $35,200 | $91,100 |
| 2017 | $4,568 | $126,300 | $35,200 | $91,100 |
| 2016 | $4,486 | $126,300 | $35,200 | $91,100 |
| 2015 | $4,620 | $126,300 | $35,200 | $91,100 |
| 2014 | $5,401 | $97,100 | $15,700 | $81,400 |
Source: Public Records
Map
Nearby Homes