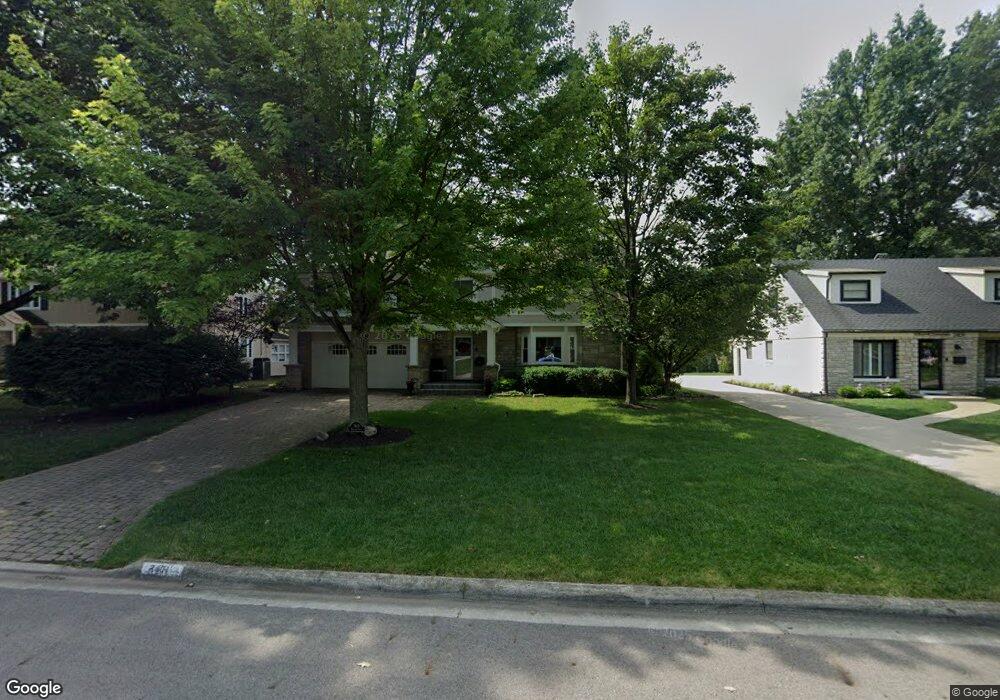
2401 Brixton Rd Columbus, OH 43221
Estimated Value: $961,821 - $1,379,000
4
Beds
3
Baths
3,262
Sq Ft
$349/Sq Ft
Est. Value
About This Home
This home is located at 2401 Brixton Rd, Columbus, OH 43221 and is currently estimated at $1,136,955, approximately $348 per square foot. 2401 Brixton Rd is a home located in Franklin County with nearby schools including Tremont Elementary School, Jones Middle School, and Upper Arlington High School.
Ownership History
Date
Name
Owned For
Owner Type
Purchase Details
Closed on
Jun 18, 2010
Sold by
Soronen Scott W and Soronen Sandra J
Bought by
Patterson Wesley D and Patterson Karen J
Current Estimated Value
Home Financials for this Owner
Home Financials are based on the most recent Mortgage that was taken out on this home.
Original Mortgage
$190,000
Outstanding Balance
$126,649
Interest Rate
4.86%
Mortgage Type
New Conventional
Estimated Equity
$1,010,306
Purchase Details
Closed on
May 15, 1997
Sold by
Hollis Joseph J and Hollis Carole A
Bought by
Soronen Scott W and Soronen Sandra J
Home Financials for this Owner
Home Financials are based on the most recent Mortgage that was taken out on this home.
Original Mortgage
$150,000
Interest Rate
8.27%
Purchase Details
Closed on
Jul 9, 1991
Purchase Details
Closed on
Dec 1, 1986
Create a Home Valuation Report for This Property
The Home Valuation Report is an in-depth analysis detailing your home's value as well as a comparison with similar homes in the area
Home Values in the Area
Average Home Value in this Area
Purchase History
| Date | Buyer | Sale Price | Title Company |
|---|---|---|---|
| Patterson Wesley D | $560,000 | Transcounty | |
| Soronen Scott W | $350,000 | Chicago Title | |
| -- | $180,000 | -- | |
| -- | $137,500 | -- |
Source: Public Records
Mortgage History
| Date | Status | Borrower | Loan Amount |
|---|---|---|---|
| Open | Patterson Wesley D | $190,000 | |
| Previous Owner | Soronen Scott W | $150,000 |
Source: Public Records
Tax History Compared to Growth
Tax History
| Year | Tax Paid | Tax Assessment Tax Assessment Total Assessment is a certain percentage of the fair market value that is determined by local assessors to be the total taxable value of land and additions on the property. | Land | Improvement |
|---|---|---|---|---|
| 2024 | $15,309 | $264,430 | $94,120 | $170,310 |
| 2023 | $15,119 | $264,425 | $94,115 | $170,310 |
| 2022 | $17,646 | $252,530 | $51,210 | $201,320 |
| 2021 | $15,621 | $252,530 | $51,210 | $201,320 |
| 2020 | $15,496 | $252,530 | $51,210 | $201,320 |
| 2019 | $14,201 | $204,790 | $51,210 | $153,580 |
| 2018 | $13,744 | $204,860 | $51,210 | $153,650 |
| 2017 | $13,735 | $204,860 | $51,210 | $153,650 |
| 2016 | $13,374 | $202,270 | $61,740 | $140,530 |
| 2015 | $13,362 | $202,270 | $61,740 | $140,530 |
| 2014 | $13,377 | $202,270 | $61,740 | $140,530 |
| 2013 | $6,388 | $183,890 | $56,140 | $127,750 |
Source: Public Records
Map
Nearby Homes
- 2979 Avalon Rd
- 3041 Avalon Rd
- 2593 Coventry Rd
- 2227 Zollinger Rd
- 2594 Scioto View Ln Unit 2594
- 2370 Zollinger Rd
- 2571 Scioto View Ln Unit K
- 3163 S Dorchester Rd
- 2782 Chateau Cir S Unit 45
- 2785 Chateau Cir Unit 69
- 2544 Zollinger Rd
- 2731 Clifton Rd
- 3190 Kioka Ave
- 2600 Henthorn Rd
- 1909 Inchcliff Rd
- 2527 Wickliffe Rd
- 2063 Westover Rd
- 2833 Katmai Dr
- 2841 Katmai Dr
- 2835 Katmai Dr
- 2409 Brixton Rd
- 2393 Brixton Rd
- 2417 Brixton Rd
- 2383 Brixton Rd
- 2404 Abington Rd
- 2416 Abington Rd
- 2394 Abington Rd
- 2760 Asbury Dr
- 2398 Brixton Rd
- 2390 Brixton Rd
- 2375 Brixton Rd
- 2406 Brixton Rd
- 2384 Abington Rd
- 2382 Brixton Rd
- 2414 Brixton Rd
- 2374 Brixton Rd
- 2365 Brixton Rd
- 2439 Brixton Rd
- 2376 Abington Rd
- 2366 Brixton Rd