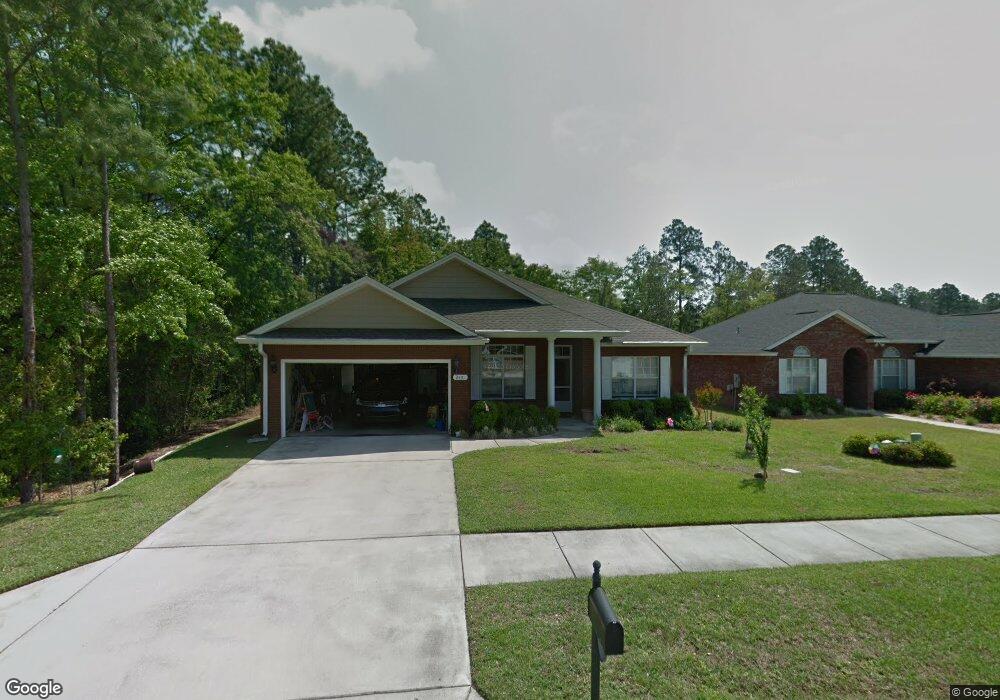
2401 Camryns Crossing Lynn Haven, FL 32444
Estimated Value: $356,000 - $379,000
3
Beds
2
Baths
1,867
Sq Ft
$198/Sq Ft
Est. Value
About This Home
This home is located at 2401 Camryns Crossing, Lynn Haven, FL 32444 and is currently estimated at $369,230, approximately $197 per square foot. 2401 Camryns Crossing is a home located in Bay County with nearby schools including Hiland Park Elementary School, Mowat Middle School, and A. Crawford Mosley High School.
Ownership History
Date
Name
Owned For
Owner Type
Purchase Details
Closed on
Sep 5, 2023
Sold by
Schull Derrick
Bought by
Schull Derrick and Schull Donna Jean
Current Estimated Value
Purchase Details
Closed on
Nov 30, 2022
Sold by
Clark Michael C
Bought by
Schull Derrick
Home Financials for this Owner
Home Financials are based on the most recent Mortgage that was taken out on this home.
Original Mortgage
$220,000
Interest Rate
6.95%
Mortgage Type
New Conventional
Purchase Details
Closed on
May 9, 2022
Sold by
Darlene Durso
Bought by
Clark Michael C and Clark James D
Purchase Details
Closed on
Jan 11, 2007
Sold by
Durso Darlene
Bought by
Durso Darlene and Clark Michael C
Purchase Details
Closed on
Aug 14, 2006
Sold by
Noah Garrett & Sons Inc
Bought by
Durso Darlene
Create a Home Valuation Report for This Property
The Home Valuation Report is an in-depth analysis detailing your home's value as well as a comparison with similar homes in the area
Home Values in the Area
Average Home Value in this Area
Purchase History
| Date | Buyer | Sale Price | Title Company |
|---|---|---|---|
| Schull Derrick | $100 | None Listed On Document | |
| Schull Derrick | $330,000 | -- | |
| Clark Michael C | -- | Brian Lit Carr Law Group Pa | |
| Durso Darlene | -- | None Available | |
| Durso Darlene | $305,000 | None Available |
Source: Public Records
Mortgage History
| Date | Status | Borrower | Loan Amount |
|---|---|---|---|
| Previous Owner | Schull Derrick | $220,000 |
Source: Public Records
Tax History Compared to Growth
Tax History
| Year | Tax Paid | Tax Assessment Tax Assessment Total Assessment is a certain percentage of the fair market value that is determined by local assessors to be the total taxable value of land and additions on the property. | Land | Improvement |
|---|---|---|---|---|
| 2024 | $4,423 | $284,571 | $60,600 | $223,971 |
| 2023 | $4,423 | $281,907 | $56,177 | $225,730 |
| 2022 | $1,597 | $173,122 | $0 | $0 |
| 2021 | $1,575 | $168,080 | $0 | $0 |
| 2020 | $1,431 | $165,759 | $0 | $0 |
| 2019 | $1,374 | $163,803 | $42,297 | $121,506 |
| 2018 | $1,682 | $183,123 | $0 | $0 |
| 2017 | $1,661 | $179,357 | $0 | $0 |
| 2016 | $1,641 | $175,579 | $0 | $0 |
| 2015 | $2,124 | $174,358 | $0 | $0 |
| 2014 | $2,165 | $177,136 | $0 | $0 |
Source: Public Records
Map
Nearby Homes
- 2531 E 40th Plaza
- 4231 Florida 389
- 0 Florida 389
- 1216 Conolly Blvd
- 1278 Conolly Blvd
- 1234 Dundee Ln
- 1666 Caleigh Ct
- 1227 Dundee Ln
- 2610 E 37th St
- 2806 Broad Wing Ave
- 4604 Britton Rd
- 4527 Hilltop Ln
- 2742 County Road 390
- - E 26th St
- 0 Britton Rd
- 2906 Harrier St
- 1534 E Highway 390
- 105 Saratoga Place
- 1707 Sutherland Rd
- 1600 Inverness Rd
- 2401 Camryns Crossing
- 2403 Camryns Crossing
- 2317 Camryns Crossing
- 2405 Camryns Crossing
- 2404 Dragonfly Ln
- 2404 Dragonfly Ln
- 63 Camryns Crossing
- 66 Camryns Crossing
- 2315 Camryns Crossing
- 2315 Camryns Crossing
- 2400 Camryns Crossing
- 17 Camryns Crossing
- 2400 Camryns Crossing
- 2402 Dragonfly Ln
- 2402 Dragonfly Ln
- 64 Camryns Crossing
- 2318 Camryns Crossing
- 2318 Camryns Crossing
- 2402 Camryns Crossing
- 2402 Camryns Crossing