Estimated Value: $147,000 - $163,000
--
Bed
1
Bath
1,082
Sq Ft
$144/Sq Ft
Est. Value
About This Home
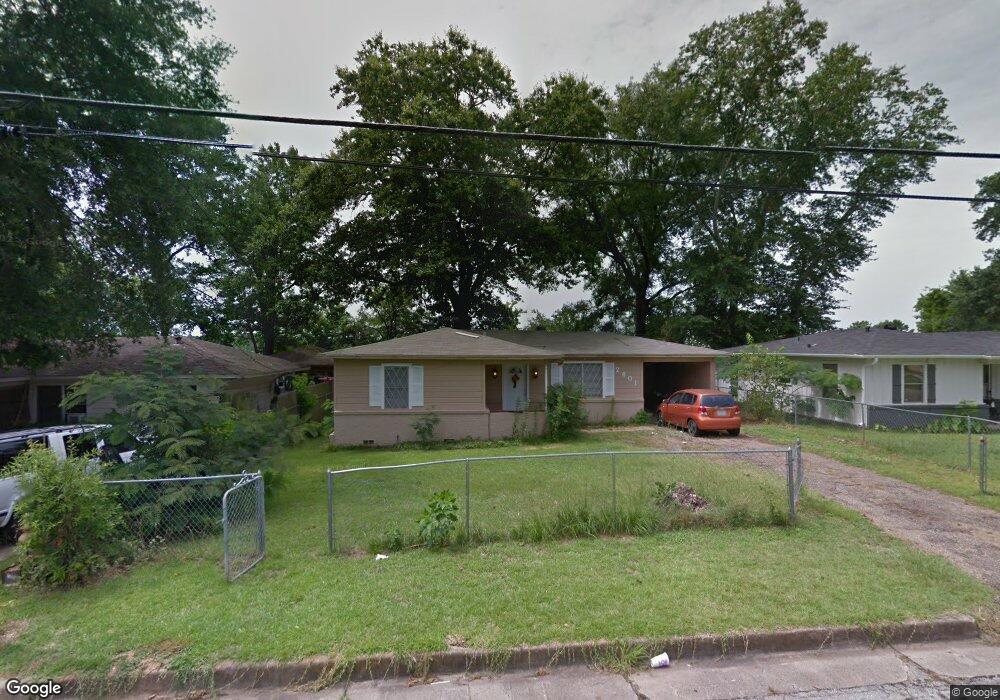
This home is located at 2401 Plume Dr, Tyler, TX 75703 and is currently estimated at $156,129, approximately $144 per square foot. 2401 Plume Dr is a home located in Smith County with nearby schools including Clarkston Elementary School, Hubbard Middle School, and Tyler Legacy High School.
Ownership History
Date
Name
Owned For
Owner Type
Purchase Details
Closed on
Feb 15, 2011
Sold by
Fannie Mae
Bought by
First Southwest Property Inc
Current Estimated Value
Home Financials for this Owner
Home Financials are based on the most recent Mortgage that was taken out on this home.
Original Mortgage
$40,800
Outstanding Balance
$27,606
Interest Rate
4.7%
Mortgage Type
Purchase Money Mortgage
Estimated Equity
$128,523
Purchase Details
Closed on
May 4, 2007
Sold by
Gonzalez Olga T
Bought by
Zaragoza Evelyn
Home Financials for this Owner
Home Financials are based on the most recent Mortgage that was taken out on this home.
Original Mortgage
$77,900
Interest Rate
6.13%
Mortgage Type
Purchase Money Mortgage
Create a Home Valuation Report for This Property
The Home Valuation Report is an in-depth analysis detailing your home's value as well as a comparison with similar homes in the area
Home Values in the Area
Average Home Value in this Area
Purchase History
| Date | Buyer | Sale Price | Title Company |
|---|---|---|---|
| First Southwest Property Inc | -- | Independence Title Company | |
| First Southwest Property Inc | -- | Independence Title Company | |
| Zaragoza Evelyn | -- | None Available |
Source: Public Records
Mortgage History
| Date | Status | Borrower | Loan Amount |
|---|---|---|---|
| Open | First Southwest Property Inc | $40,800 | |
| Closed | First Southwest Property Inc | $40,800 | |
| Previous Owner | Zaragoza Evelyn | $77,900 |
Source: Public Records
Tax History Compared to Growth
Tax History
| Year | Tax Paid | Tax Assessment Tax Assessment Total Assessment is a certain percentage of the fair market value that is determined by local assessors to be the total taxable value of land and additions on the property. | Land | Improvement |
|---|---|---|---|---|
| 2025 | $1,772 | $98,577 | $24,670 | $73,907 |
| 2024 | $1,772 | $104,164 | $23,100 | $81,064 |
| 2023 | $1,514 | $86,828 | $23,100 | $63,728 |
| 2022 | $1,524 | $77,780 | $23,100 | $54,680 |
| 2021 | $1,085 | $51,726 | $23,100 | $28,626 |
| 2020 | $1,054 | $49,254 | $23,100 | $26,154 |
| 2019 | $971 | $44,426 | $9,240 | $35,186 |
| 2018 | $920 | $42,314 | $9,240 | $33,074 |
| 2017 | $903 | $42,314 | $9,240 | $33,074 |
| 2016 | $881 | $41,272 | $9,240 | $32,032 |
| 2015 | $1,119 | $53,882 | $9,240 | $44,642 |
| 2014 | $1,119 | $52,663 | $9,240 | $43,423 |
Source: Public Records
Map
Nearby Homes
- 3801 Old Troup Hwy
- 2417 Riviera Dr
- 2631 Amy Ln
- 2006 Villa Dr
- 2226 Mimosa Dr
- 2830 Juniper Ln
- 2007 Villa Dr
- 2512 Alta Mira Dr
- 2108 Aberdeen Dr
- 4314 Aberdeen Dr
- 3024 Royal Garden Rd
- 2014 Miller Dr
- 3700 Woodbine Blvd
- The Dawson Plan at New Home Living at Medina
- 2949 Medina Dr
- The Hubbard Plan at New Home Living at Medina
- 4505 Inverness Dr
- 2509 Delmar Dr
- 2002 E Faulkner St
- 2716 Royal Village Way