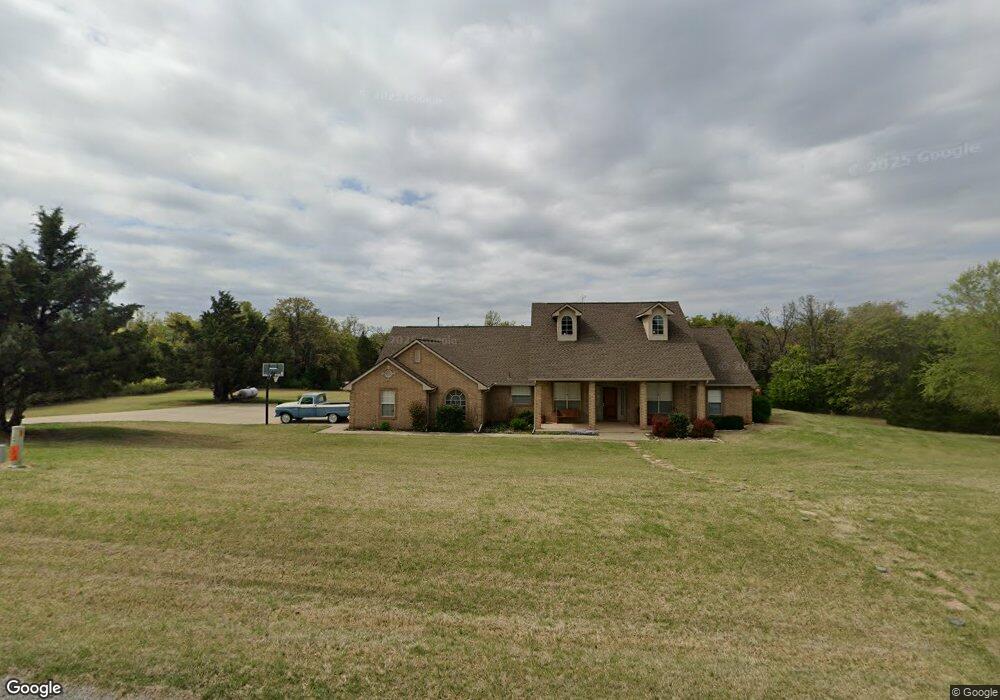
2401 Sandpiper Dr Blanchard, OK 73010
West Blanchard NeighborhoodEstimated Value: $417,333 - $453,000
4
Beds
2
Baths
2,357
Sq Ft
$184/Sq Ft
Est. Value
About This Home
This home is located at 2401 Sandpiper Dr, Blanchard, OK 73010 and is currently estimated at $433,333, approximately $183 per square foot. 2401 Sandpiper Dr is a home located in Grady County with nearby schools including Middleberg Public School.
Ownership History
Date
Name
Owned For
Owner Type
Purchase Details
Closed on
Oct 14, 2022
Sold by
Shults Justin L and Shults Lea
Bought by
Tolliver Louis and Tolliver Dawn
Current Estimated Value
Home Financials for this Owner
Home Financials are based on the most recent Mortgage that was taken out on this home.
Original Mortgage
$308,000
Outstanding Balance
$295,981
Interest Rate
6.02%
Mortgage Type
New Conventional
Estimated Equity
$137,352
Purchase Details
Closed on
Jun 30, 2017
Sold by
Rennie John
Bought by
Shults Justin L
Home Financials for this Owner
Home Financials are based on the most recent Mortgage that was taken out on this home.
Original Mortgage
$188,000
Interest Rate
3.95%
Mortgage Type
Commercial
Purchase Details
Closed on
Dec 31, 2012
Sold by
Frontier State Bank
Bought by
Rennie John and Rennie Carolyn
Purchase Details
Closed on
Aug 5, 2004
Sold by
Casa Grande Homes, Inc.
Bought by
Premier Investment Proper
Create a Home Valuation Report for This Property
The Home Valuation Report is an in-depth analysis detailing your home's value as well as a comparison with similar homes in the area
Home Values in the Area
Average Home Value in this Area
Purchase History
| Date | Buyer | Sale Price | Title Company |
|---|---|---|---|
| Tolliver Louis | -- | Chicago Title | |
| Shults Justin L | $235,000 | American Eagle Title Group | |
| Rennie John | -- | None Available | |
| Premier Investment Proper | $1,833,300 | -- |
Source: Public Records
Mortgage History
| Date | Status | Borrower | Loan Amount |
|---|---|---|---|
| Open | Tolliver Louis | $308,000 | |
| Previous Owner | Shults Justin L | $188,000 |
Source: Public Records
Tax History Compared to Growth
Tax History
| Year | Tax Paid | Tax Assessment Tax Assessment Total Assessment is a certain percentage of the fair market value that is determined by local assessors to be the total taxable value of land and additions on the property. | Land | Improvement |
|---|---|---|---|---|
| 2025 | $3,513 | $44,929 | $5,817 | $39,112 |
| 2024 | $3,436 | $43,620 | $5,648 | $37,972 |
| 2023 | $3,436 | $42,350 | $8,470 | $33,880 |
| 2022 | $2,255 | $31,061 | $4,823 | $26,238 |
| 2021 | $2,268 | $30,547 | $4,823 | $25,724 |
| 2020 | $2,161 | $29,130 | $4,174 | $24,956 |
| 2019 | $2,013 | $28,385 | $4,174 | $24,211 |
| 2018 | $2,406 | $30,846 | $6,863 | $23,983 |
| 2017 | $2,410 | $31,101 | $6,863 | $24,238 |
| 2016 | $2,569 | $30,988 | $6,696 | $24,292 |
| 2015 | $2,336 | $30,085 | $7,234 | $22,851 |
| 2014 | $2,336 | $30,353 | $6,984 | $23,369 |
Source: Public Records
Map
Nearby Homes
- 2367 W Lake Way
- 2314 County Road 1336
- 2293 County Road 1333
- 1810 Sandpiper Dr
- 000 U S Highway 62
- 4210 Paradise Dr
- 2262 County Road 1314
- 3150 Rolling Hills Dr
- 2009 Ethan's Roar Rd
- 2321 Lions Pride Way
- 2311 Lions Pride Way
- 2005 Ethan's Roar Rd
- 0 Old Highway 62
- 2400 Whiteoak Dr
- 0 Oil Lease Rd
- 1925 Valley Ranch Rd
- 1540 County Street 2960
- 1640 Cs 2960
- 2356 SW 7th St
- 1988 Southern Trace Ln
- 2401 Sandpiper Dr
- 2409 Sandpiper Dr
- 2400 Sandpiper Dr
- 2355 Sandpiper Dr
- 1139 SW 22nd St
- 2336 Sandpiper Dr
- 2405 Sandpiper Dr
- 2287 Sandpiper Dr
- 2274 Sandpiper Dr
- 2458 S Sara Ave
- 2267 Sandpiper Dr
- 2231 Sandpiper Dr
- 2261 Sandpiper Dr
- 2191 Sandpiper Dr
- 2220 Sandpiper Dr
- 2160 Sandpiper Dr
- 2408 Sandpiper Dr
- 2723 W Lake Way
- 3340 Pintail Cir
- 3606 Meadow Lark Ln