
Seller's Agent in 2018
Karen Neal
Benchmark Realty, LLC
(615) 305-7468
2 in this area
36 Total Sales

Estimated Value: $436,000 - $454,000
Please note, our homes are available on a first-come, first-serve basis and are not reserved until the lease is signed by all applicants and security deposits are collected.
This home features Progress Smart Home - Progress Residential's smart home app, which allows you to control the home securely from any of your devices. Learn more at
Want to tour on your own? Click the “Self Tour” button on this home’s listing or call to register for a self-guided showing at a time that works best for you.
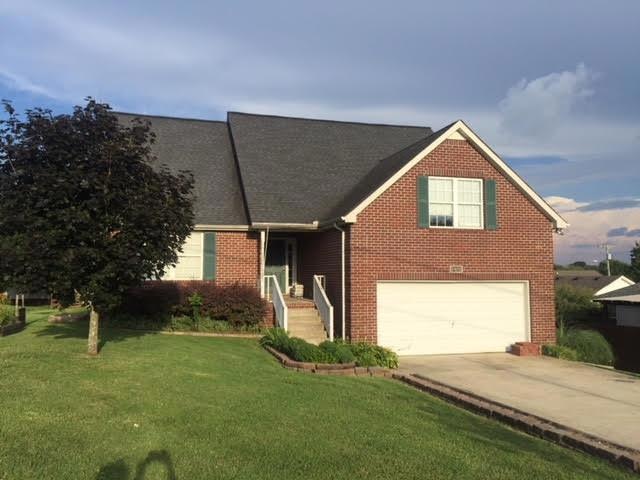
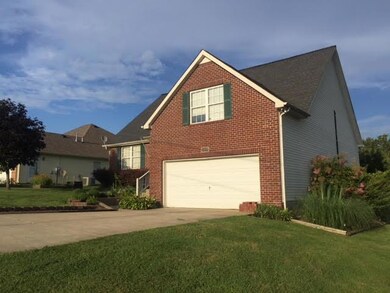
Interested in this home? You clearly have exceptional taste. This charming 3-bedroom, 2-bathroom home is not only pet-friendly, but also equipped with smart home features to make everyday life more convenient and connected. Homes like this don’t stay on the market for long—don’t miss your chance to make it yours. Apply today!
Last Agent to Sell the Property
Benchmark Realty, LLC License #251892 Listed on: 07/12/2018
We collect this data history from publicly available records. To have your information removed, we recommend requesting removal directly through your county’s website.
We collect this data history from publicly available records. To have your information removed, we recommend requesting removal directly through your county’s website.
| Date | Buyer | Sale Price | Title Company |
|---|---|---|---|
| $220,000 | Realty Title & Escrow | ||
| -- | None Available | ||
| $584,763 | -- | ||
| $60,000 | -- |
We collect this data history from publicly available records. To have your information removed, we recommend requesting removal directly through your county’s website.
| Date | Status | Borrower | Loan Amount |
|---|---|---|---|
| Previous Owner | $440,800 |
We collect this data history from publicly available records. To have your information removed, we recommend requesting removal directly through your county’s website.
| Date | Event | Price | List to Sale | Price per Sq Ft |
|---|---|---|---|---|
| 11/04/2025 11/04/25 | Off Market | $2,115 | -- | -- |
| 10/24/2025 10/24/25 | Price Changed | $2,115 | +2.4% | $1 / Sq Ft |
| 10/23/2025 10/23/25 | Price Changed | $2,065 | -2.1% | $1 / Sq Ft |
| 10/22/2025 10/22/25 | Price Changed | $2,110 | -1.2% | $1 / Sq Ft |
| 10/21/2025 10/21/25 | Price Changed | $2,135 | -2.3% | $1 / Sq Ft |
| 10/18/2025 10/18/25 | Price Changed | $2,185 | -2.9% | $1 / Sq Ft |
| 10/17/2025 10/17/25 | Price Changed | $2,250 | +3.0% | $1 / Sq Ft |
| 10/16/2025 10/16/25 | Price Changed | $2,185 | -2.7% | $1 / Sq Ft |
| 10/15/2025 10/15/25 | Price Changed | $2,245 | -1.1% | $1 / Sq Ft |
| 10/14/2025 10/14/25 | Price Changed | $2,270 | -2.4% | $1 / Sq Ft |
| 10/11/2025 10/11/25 | Price Changed | $2,325 | -2.9% | $1 / Sq Ft |
| 10/09/2025 10/09/25 | Price Changed | $2,395 | +5.3% | $1 / Sq Ft |
| 10/02/2025 10/02/25 | Price Changed | $2,275 | -2.2% | $1 / Sq Ft |
| 09/24/2025 09/24/25 | Price Changed | $2,325 | -1.9% | $1 / Sq Ft |
| 09/13/2025 09/13/25 | Price Changed | $2,370 | -2.1% | $1 / Sq Ft |
| 08/30/2025 08/30/25 | Price Changed | $2,420 | -0.8% | $1 / Sq Ft |
| 08/26/2025 08/26/25 | Price Changed | $2,440 | -0.6% | $1 / Sq Ft |
| 08/15/2025 08/15/25 | Price Changed | $2,455 | -24.7% | $1 / Sq Ft |
| 08/12/2025 08/12/25 | For Rent | $3,260 | 0.0% | -- |
| 04/07/2021 04/07/21 | Off Market | $220,000 | -- | -- |
| 03/03/2021 03/03/21 | For Sale | $25,000 | -88.6% | $14 / Sq Ft |
| 07/31/2018 07/31/18 | Sold | $220,000 | -- | $123 / Sq Ft |
We collect this data history from publicly available records. To have your information removed, we recommend requesting removal directly through your county’s website.
| Year | Tax Paid | Tax Assessment Tax Assessment Total Assessment is a certain percentage of the fair market value that is determined by local assessors to be the total taxable value of land and additions on the property. | Land | Improvement |
|---|---|---|---|---|
| 2025 | $534 | $111,775 | $30,000 | $81,775 |
| 2024 | $534 | $72,275 | $15,000 | $57,275 |
| 2023 | $534 | $72,275 | $15,000 | $57,275 |
| 2022 | $1,323 | $72,275 | $15,000 | $57,275 |
| 2021 | $1,323 | $72,275 | $15,000 | $57,275 |
| 2020 | $1,119 | $51,825 | $10,000 | $41,825 |
| 2019 | $1,119 | $51,825 | $10,000 | $41,825 |
| 2018 | $1,083 | $51,825 | $10,000 | $41,825 |
| 2017 | $1,073 | $51,825 | $10,000 | $41,825 |
| 2016 | $0 | $51,825 | $10,000 | $41,825 |
| 2015 | -- | $43,025 | $8,750 | $34,275 |
| 2014 | -- | $43,025 | $8,750 | $34,275 |
Seller's Agent in 2018
Karen Neal
Benchmark Realty, LLC
(615) 305-7468
2 in this area
36 Total Sales
Buyer's Agent in 2018
Erin Krueger
Compass Tennessee, LLC
(615) 509-7166
54 in this area
657 Total Sales
Source: Realtracs
MLS Number: 1948661
APN: 153L-K-015.00
Disclaimer: Certain information contained herein is derived from information provided by parties other than Homes.com. All information provided is deemed reliable, but is not guaranteed to be accurate and should be independently verified.
![]() All data is obtained from various sources and may not have been verified by broker or MLS GRID. Supplied Open House Information is subject to change without notice. All information should be independently reviewed and verified for accuracy. Properties may or may not be listed by the office/agent presenting the information. Some IDX listings have been excluded from this website.
All data is obtained from various sources and may not have been verified by broker or MLS GRID. Supplied Open House Information is subject to change without notice. All information should be independently reviewed and verified for accuracy. Properties may or may not be listed by the office/agent presenting the information. Some IDX listings have been excluded from this website.
Listings courtesy of Realtracs as distributed by MLS GRID.
Based on information submitted to the MLS GRID
Ask me questions while you tour the home.