2402 Cheryle Way Layton, UT 84040
Estimated Value: $584,000 - $613,000
4
Beds
4
Baths
2,489
Sq Ft
$242/Sq Ft
Est. Value
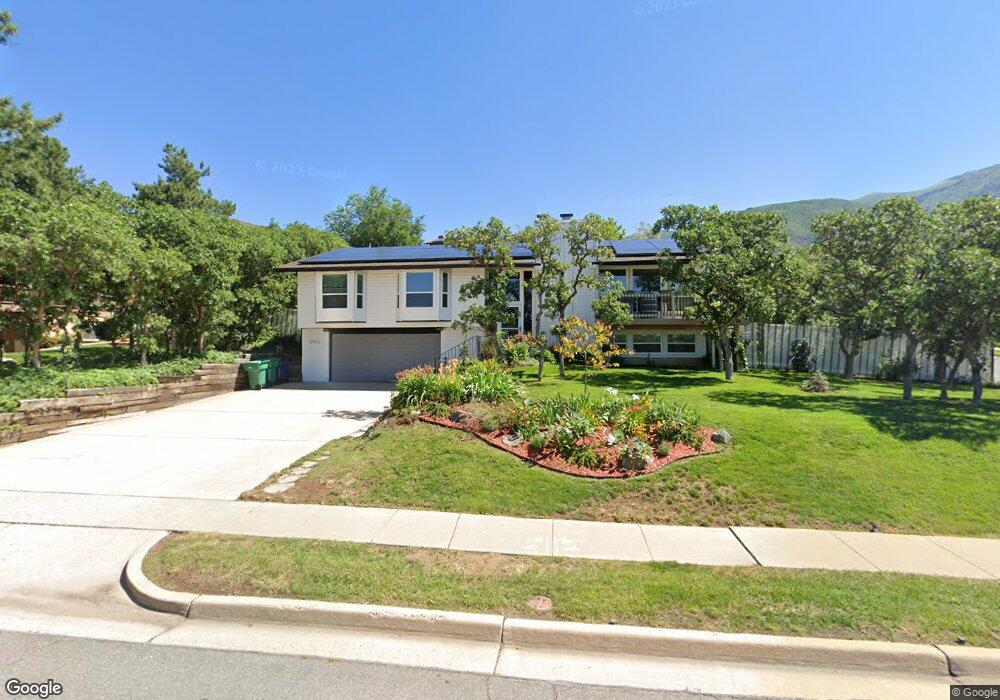
About This Home
This home is located at 2402 Cheryle Way, Layton, UT 84040 and is currently estimated at $601,397, approximately $241 per square foot. 2402 Cheryle Way is a home located in Davis County with nearby schools including Sarah Jane Adams Elementary School, North Layton Junior High School, and Northridge High School.
Ownership History
Date
Name
Owned For
Owner Type
Purchase Details
Closed on
May 20, 2020
Sold by
Brooks Lawrence and Brooks Triste
Bought by
Stimpson Casey and Dawson Andrew
Current Estimated Value
Home Financials for this Owner
Home Financials are based on the most recent Mortgage that was taken out on this home.
Original Mortgage
$365,750
Outstanding Balance
$322,682
Interest Rate
3.3%
Mortgage Type
New Conventional
Estimated Equity
$278,715
Purchase Details
Closed on
Dec 1, 2016
Sold by
Sas Michelle Fessler
Bought by
Brooks Lawrence and Brooks Triste
Purchase Details
Closed on
Oct 14, 1999
Sold by
Beckstead M Klean and Beckstead Marvin D
Bought by
Beckstead Joann
Purchase Details
Closed on
Nov 12, 1997
Sold by
Beckstead M Dean and Fessler Jo Ann
Bought by
Beckstead M Dean and Beckstead Jo Ann
Home Financials for this Owner
Home Financials are based on the most recent Mortgage that was taken out on this home.
Original Mortgage
$90,000
Interest Rate
7.3%
Create a Home Valuation Report for This Property
The Home Valuation Report is an in-depth analysis detailing your home's value as well as a comparison with similar homes in the area
Home Values in the Area
Average Home Value in this Area
Purchase History
| Date | Buyer | Sale Price | Title Company |
|---|---|---|---|
| Stimpson Casey | -- | Legends Title Llc | |
| Brooks Lawrence | -- | First American Title | |
| Beckstead Joann | -- | -- | |
| Beckstead M Dean | -- | Inwest Title Services Inc |
Source: Public Records
Mortgage History
| Date | Status | Borrower | Loan Amount |
|---|---|---|---|
| Open | Stimpson Casey | $365,750 | |
| Previous Owner | Beckstead M Dean | $90,000 |
Source: Public Records
Tax History
| Year | Tax Paid | Tax Assessment Tax Assessment Total Assessment is a certain percentage of the fair market value that is determined by local assessors to be the total taxable value of land and additions on the property. | Land | Improvement |
|---|---|---|---|---|
| 2025 | $3,149 | $302,500 | $130,089 | $172,411 |
| 2024 | $2,995 | $292,050 | $150,540 | $141,510 |
| 2023 | $3,011 | $524,000 | $198,443 | $325,557 |
| 2022 | $3,106 | $295,350 | $106,839 | $188,511 |
| 2021 | $0 | $392,000 | $163,232 | $228,768 |
| 2020 | $2,439 | $329,000 | $134,714 | $194,286 |
| 2019 | $2,363 | $314,000 | $119,788 | $194,212 |
| 2018 | $2,154 | $287,000 | $95,252 | $191,748 |
| 2016 | $1,969 | $137,995 | $49,714 | $88,281 |
| 2015 | $2,006 | $131,175 | $49,714 | $81,461 |
| 2014 | $1,832 | $126,328 | $49,714 | $76,614 |
| 2013 | -- | $126,807 | $33,932 | $92,875 |
Source: Public Records
Map
Nearby Homes
- 2563 E 2250 N
- 2597 N 2300 E
- 2136 N 2800 E
- 2569 N 2900 E
- 1954 N 2600 E
- 2340 N 2050 E
- 2547 E 1900 N
- 2509 E 1900 N
- 2353 Canyon View Dr
- 2273 N 1975 E
- 1960 N 2150 E
- 1907 N Bridge Ct
- 2391 Kays Creek Dr
- 2189 N 1950 E
- 1935 Deere Valley Dr
- 1911 Deere Valley Dr
- 3142 E Thorley Dr
- 3138 E Thorley Dr
- 1785 E 2825 N
- 1731 E 2825 N
- 2420 Cheryle Way
- 2419 N 2550 E
- 2544 Joni Dr
- 2520 Joni Dr
- 2383 Cheryle Way
- 2437 N 2550 E
- 2401 Cheryle Way
- 2438 Cheryle Way
- 2502 Joni Dr
- 2550 Joni Dr
- 2354 Cheryle Way
- 2419 Cheryle Way
- 2352 Raelyn Way
- 2455 N 2550 E
- 2450 Cheryle Way
- 2360 Raelyn Way
- 2337 Cheryle Way
- 2578 Joni Dr
- 2346 Raelyn Way
- 2458 N 2550 E
Your Personal Tour Guide
Ask me questions while you tour the home.