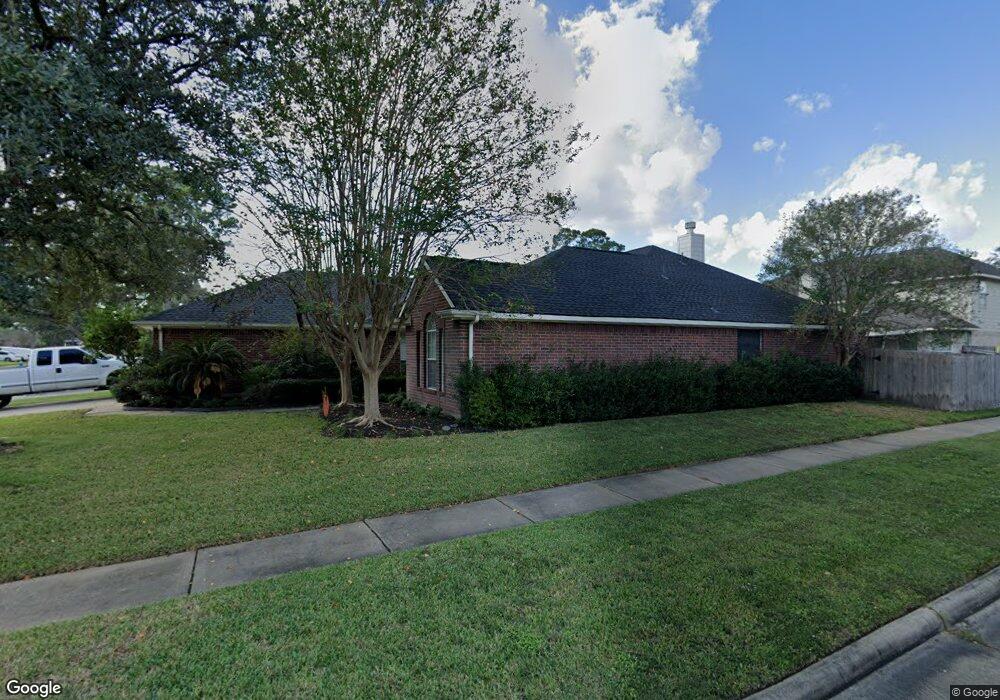
2402 Crescent Hollow Ct Spring, TX 77388
Estimated Value: $314,000 - $351,000
4
Beds
2
Baths
2,433
Sq Ft
$135/Sq Ft
Est. Value
About This Home
This home is located at 2402 Crescent Hollow Ct, Spring, TX 77388 and is currently estimated at $327,800, approximately $134 per square foot. 2402 Crescent Hollow Ct is a home located in Harris County with nearby schools including Kreinhop Elementary School, Schindewolf Intermediate School, and Klein Collins High School.
Ownership History
Date
Name
Owned For
Owner Type
Purchase Details
Closed on
May 3, 2022
Sold by
Yvonne Granado Linda
Bought by
Granado Linda Yvonne
Current Estimated Value
Purchase Details
Closed on
Sep 7, 2005
Sold by
Salinas Richard J and Salinas Yvonne M
Bought by
Granado Alfred and Granado Linda
Home Financials for this Owner
Home Financials are based on the most recent Mortgage that was taken out on this home.
Original Mortgage
$23,325
Interest Rate
5.88%
Mortgage Type
Unknown
Purchase Details
Closed on
May 29, 1998
Sold by
George Wimpey Of Texas Inc
Bought by
Salinas Richard J and Salinas Yvonne M
Home Financials for this Owner
Home Financials are based on the most recent Mortgage that was taken out on this home.
Original Mortgage
$119,550
Interest Rate
7.22%
Create a Home Valuation Report for This Property
The Home Valuation Report is an in-depth analysis detailing your home's value as well as a comparison with similar homes in the area
Home Values in the Area
Average Home Value in this Area
Purchase History
| Date | Buyer | Sale Price | Title Company |
|---|---|---|---|
| Granado Linda Yvonne | -- | None Listed On Document | |
| Granado Alfred | -- | -- | |
| Salinas Richard J | -- | American Title |
Source: Public Records
Mortgage History
| Date | Status | Borrower | Loan Amount |
|---|---|---|---|
| Previous Owner | Granado Alfred | $23,325 | |
| Previous Owner | Granado Alfred | $124,400 | |
| Previous Owner | Salinas Richard J | $119,550 |
Source: Public Records
Tax History Compared to Growth
Tax History
| Year | Tax Paid | Tax Assessment Tax Assessment Total Assessment is a certain percentage of the fair market value that is determined by local assessors to be the total taxable value of land and additions on the property. | Land | Improvement |
|---|---|---|---|---|
| 2025 | $1,228 | $344,908 | $56,573 | $288,335 |
| 2024 | $1,228 | $340,843 | $56,573 | $284,270 |
| 2023 | $1,228 | $365,386 | $56,573 | $308,813 |
| 2022 | $6,737 | $315,489 | $56,573 | $258,916 |
| 2021 | $6,458 | $226,283 | $35,358 | $190,925 |
| 2020 | $6,811 | $230,216 | $35,358 | $194,858 |
| 2019 | $7,010 | $230,216 | $35,358 | $194,858 |
| 2018 | $1,263 | $211,876 | $35,358 | $176,518 |
| 2017 | $13,276 | $211,876 | $35,358 | $176,518 |
| 2016 | $6,193 | $211,876 | $35,358 | $176,518 |
| 2015 | $2,888 | $197,983 | $35,358 | $162,625 |
| 2014 | $2,888 | $185,986 | $35,358 | $150,628 |
Source: Public Records
Map
Nearby Homes
- 2403 Crescent Hollow Ct
- 2423 Daneswood Ct
- 2410 Ligustrum Flower Dr
- 2527 Liza Ct
- 21323 Hannover Forest
- 2119 Hannover Way
- 21406 Hannover Pines Dr
- 21823 Hannover Village Dr
- 21310 Timber Pines Dr
- 1828 Holzwarth Rd
- 21510 Juniper Meadows Dr
- 2414 Hannover Valley Ct
- 1810 Emerson Ridge Dr
- 2411 Fern Lacy Ct
- 21514 Greenham Dr
- 20835 Louetta Oak Dr
- 21418 Bassbrook Dr
- 22006 Prose Ct
- 3310 Keygate Dr
- 2906 Tall Tree Ridge Way
- 2403 Daneswood Ct
- 2310 Crescent Hollow Ct
- 2410 Crescent Hollow Ct
- 2311 Daneswood Ct
- 2411 Daneswood Ct
- 2407 Crescent Hollow Ct
- 2414 Crescent Hollow Ct
- 2306 Crescent Hollow Ct
- 2411 Crescent Hollow Ct
- 2311 Crescent Hollow Ct
- 2307 Daneswood Ct
- 2415 Daneswood Ct
- 2415 Crescent Hollow Ct
- 2418 Crescent Hollow Ct
- 2307 Crescent Hollow Ct
- 2419 Daneswood Ct
- 2402 Hannover Way
- 2402 Daneswood Ct
- 2406 Hannover Way
- 2406 Daneswood Ct