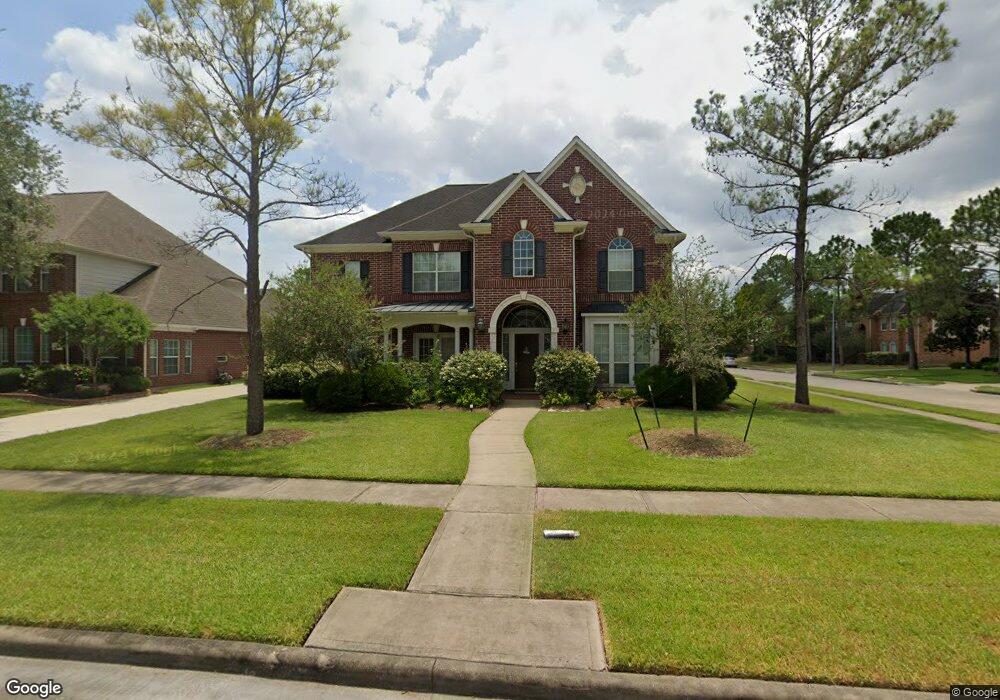
2402 Lansing Cir Pearland, TX 77584
Silverlake NeighborhoodEstimated Value: $503,273 - $523,000
4
Beds
4
Baths
3,173
Sq Ft
$162/Sq Ft
Est. Value
About This Home
This home is located at 2402 Lansing Cir, Pearland, TX 77584 and is currently estimated at $514,318, approximately $162 per square foot. 2402 Lansing Cir is a home located in Brazoria County with nearby schools including Silvercrest Elementary School, Rogers Middle School, and Berry Miller Junior High School.
Ownership History
Date
Name
Owned For
Owner Type
Purchase Details
Closed on
Sep 16, 2016
Sold by
Tong Qiang and Wu Ming
Bought by
Chow George
Current Estimated Value
Home Financials for this Owner
Home Financials are based on the most recent Mortgage that was taken out on this home.
Original Mortgage
$192,500
Outstanding Balance
$22,368
Interest Rate
3.45%
Mortgage Type
New Conventional
Estimated Equity
$491,950
Purchase Details
Closed on
Dec 23, 2002
Sold by
Hartley Joel Dean and Hartley Theresa Lynne
Bought by
Tong Qiang and Wu Ming
Home Financials for this Owner
Home Financials are based on the most recent Mortgage that was taken out on this home.
Original Mortgage
$170,400
Interest Rate
5.96%
Purchase Details
Closed on
Sep 13, 2000
Sold by
Newmark Homes
Bought by
Hartley Joel Dean and Hartley Theresa Lynne
Home Financials for this Owner
Home Financials are based on the most recent Mortgage that was taken out on this home.
Original Mortgage
$174,250
Interest Rate
8.01%
Create a Home Valuation Report for This Property
The Home Valuation Report is an in-depth analysis detailing your home's value as well as a comparison with similar homes in the area
Home Values in the Area
Average Home Value in this Area
Purchase History
| Date | Buyer | Sale Price | Title Company |
|---|---|---|---|
| Chow George | -- | None Available | |
| Tong Qiang | -- | -- | |
| Hartley Joel Dean | -- | Pacific Title |
Source: Public Records
Mortgage History
| Date | Status | Borrower | Loan Amount |
|---|---|---|---|
| Open | Chow George | $192,500 | |
| Previous Owner | Tong Qiang | $170,400 | |
| Previous Owner | Hartley Joel Dean | $174,250 |
Source: Public Records
Tax History Compared to Growth
Tax History
| Year | Tax Paid | Tax Assessment Tax Assessment Total Assessment is a certain percentage of the fair market value that is determined by local assessors to be the total taxable value of land and additions on the property. | Land | Improvement |
|---|---|---|---|---|
| 2025 | $5,676 | $432,522 | $92,310 | $364,650 |
| 2023 | $5,676 | $357,456 | $96,320 | $356,740 |
| 2022 | $7,819 | $350,350 | $36,640 | $383,100 |
| 2021 | $8,167 | $346,900 | $30,530 | $316,370 |
| 2020 | $7,888 | $308,500 | $30,530 | $277,970 |
| 2019 | $8,572 | $331,030 | $30,530 | $300,500 |
| 2018 | $8,196 | $315,000 | $30,530 | $284,470 |
| 2017 | $8,428 | $321,820 | $30,530 | $291,290 |
| 2016 | $7,415 | $318,490 | $30,530 | $287,960 |
| 2015 | $5,691 | $257,400 | $30,530 | $226,870 |
| 2014 | $5,691 | $241,700 | $30,530 | $211,170 |
Source: Public Records
Map
Nearby Homes
- 2507 Lansing Cir
- 2615 Pinebend Dr
- 3011 Taylorcrest Dr
- 2806 Dixon Dr
- 2708 Courtyard Ln
- 2603 Fair Oak St
- 3046 Barton Dr
- 2722 Sunshade Ct
- 11108 Dawson Rd
- 3326 Spring Landing Ln
- 9617 Landon Lake Dr
- 2706 April Cove Ct
- 3410 Hansford Place
- 2470 Guava Hills Ln
- 5519 Bonfire Alley
- 2423 Mission Heights Way
- 5422 Blackcurrant Rd
- 5614 Orangery Ln
- 5618 Orangery Ln
- 9115 Mangrove Place
- 2410 Lansing Cir
- 2407 Newbridge Ct
- 2411 Newbridge Ct
- 2414 Lansing Cir
- 2726 Martinec Dr
- 2730 Martinec Dr
- 2722 Martinec Dr
- 2403 Lansing Cir
- 2415 Newbridge Ct
- 2734 Martinec Dr
- 2407 Lansing Cir
- 2418 Lansing Cir
- 2718 Martinec Dr
- 2411 Lansing Cir
- 2738 Martinec Dr
- 2714 Martinec Dr
- 2415 Lansing Cir
- 2419 Newbridge Ct
- 2422 Lansing Cir
- 2402 Netherwood Ct