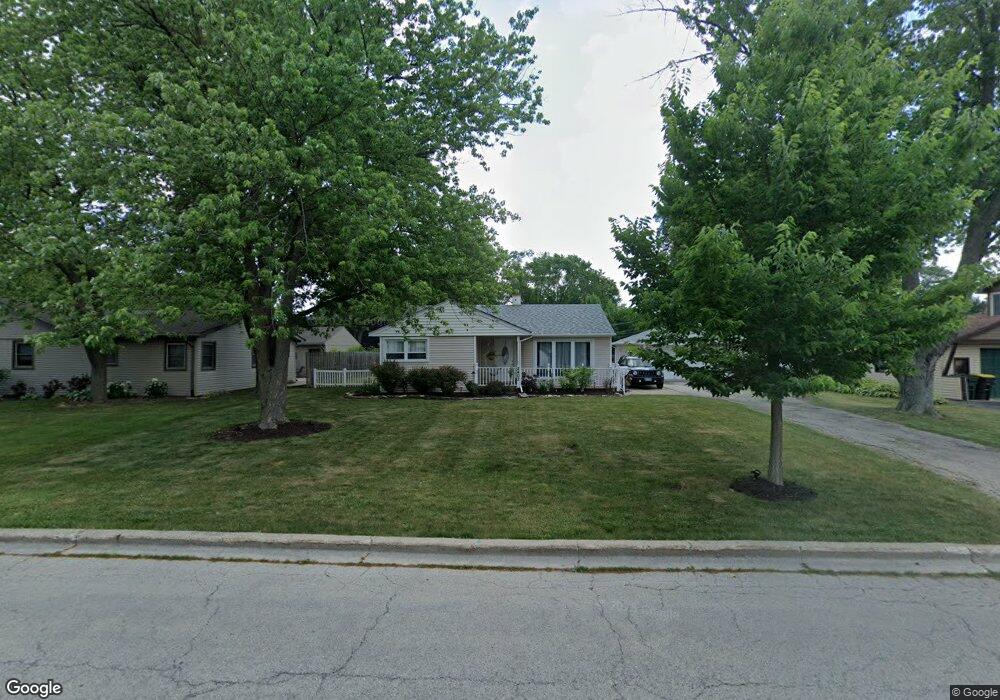
2402 Meadow Dr Rolling Meadows, IL 60008
Estimated Value: $378,000 - $382,000
4
Beds
2
Baths
1,477
Sq Ft
$257/Sq Ft
Est. Value
About This Home
This home is located at 2402 Meadow Dr, Rolling Meadows, IL 60008 and is currently estimated at $379,658, approximately $257 per square foot. 2402 Meadow Dr is a home located in Cook County with nearby schools including Kimball Hill Elementary School, Carl Sandburg Junior High School, and Rolling Meadows High School.
Ownership History
Date
Name
Owned For
Owner Type
Purchase Details
Closed on
Jul 6, 2016
Sold by
Hogue Jesse N and Hogue Victoria L
Bought by
Bochenski Radoslaw and Bochenski Ewa
Current Estimated Value
Home Financials for this Owner
Home Financials are based on the most recent Mortgage that was taken out on this home.
Original Mortgage
$241,544
Outstanding Balance
$191,509
Interest Rate
3.37%
Mortgage Type
FHA
Estimated Equity
$188,149
Purchase Details
Closed on
Feb 25, 2004
Sold by
Hogue Katherine A
Bought by
Hogue Jesse N and Hogue Victoria L
Purchase Details
Closed on
Oct 22, 1999
Sold by
Roberson Marilyn C
Bought by
Hogue Katherine A
Home Financials for this Owner
Home Financials are based on the most recent Mortgage that was taken out on this home.
Original Mortgage
$100,000
Interest Rate
7.87%
Purchase Details
Closed on
Nov 16, 1995
Sold by
Trenter Louis C
Bought by
Trenter Louis C and Louis C Trenter Family Living Trust
Create a Home Valuation Report for This Property
The Home Valuation Report is an in-depth analysis detailing your home's value as well as a comparison with similar homes in the area
Home Values in the Area
Average Home Value in this Area
Purchase History
| Date | Buyer | Sale Price | Title Company |
|---|---|---|---|
| Bochenski Radoslaw | $246,000 | Landtrust National Title | |
| Hogue Jesse N | -- | -- | |
| Hogue Katherine A | $145,000 | -- | |
| Trenter Louis C | -- | -- |
Source: Public Records
Mortgage History
| Date | Status | Borrower | Loan Amount |
|---|---|---|---|
| Open | Bochenski Radoslaw | $241,544 | |
| Previous Owner | Hogue Katherine A | $100,000 |
Source: Public Records
Tax History
| Year | Tax Paid | Tax Assessment Tax Assessment Total Assessment is a certain percentage of the fair market value that is determined by local assessors to be the total taxable value of land and additions on the property. | Land | Improvement |
|---|---|---|---|---|
| 2025 | $7,259 | $33,000 | $7,033 | $25,967 |
| 2024 | $7,259 | $27,000 | $5,951 | $21,049 |
| 2023 | $6,921 | $27,000 | $5,951 | $21,049 |
| 2022 | $6,921 | $27,000 | $5,951 | $21,049 |
| 2021 | $5,128 | $18,814 | $3,516 | $15,298 |
| 2020 | $5,081 | $18,814 | $3,516 | $15,298 |
| 2019 | $5,118 | $21,022 | $3,516 | $17,506 |
| 2018 | $6,340 | $23,008 | $3,246 | $19,762 |
| 2017 | $8,001 | $25,214 | $3,246 | $21,968 |
| 2016 | $6,715 | $25,214 | $3,246 | $21,968 |
| 2015 | $5,510 | $20,122 | $2,975 | $17,147 |
| 2014 | $5,681 | $21,052 | $2,975 | $18,077 |
| 2013 | $5,526 | $21,052 | $2,975 | $18,077 |
Source: Public Records
Map
Nearby Homes
- 2705 Park St
- 2709 Lily Ln
- 3306 Trillium Cir Unit 3001
- 3209 Trillium Cir
- 3100 Town Square Dr Unit 308
- 3100 Town Square Dr Unit 204
- 1506 W Northwest Hwy
- 1215 W Sigwalt St Unit A
- 912 N Chicago Ave
- 2201 Kingfisher Ln
- 3135 Town Square Dr Unit 401
- 3265 Kirchoff Rd Unit 116
- 408 N Kennicott Ave
- 2401 Rohlwing Rd
- 3345 Kirchoff Rd Unit 5C
- 3605 Oriole Ln
- 27 S Kaspar Ave
- 628 S Wilke Rd
- 3200 Thrush Ln
- 3710 Meadow Dr
Your Personal Tour Guide
Ask me questions while you tour the home.