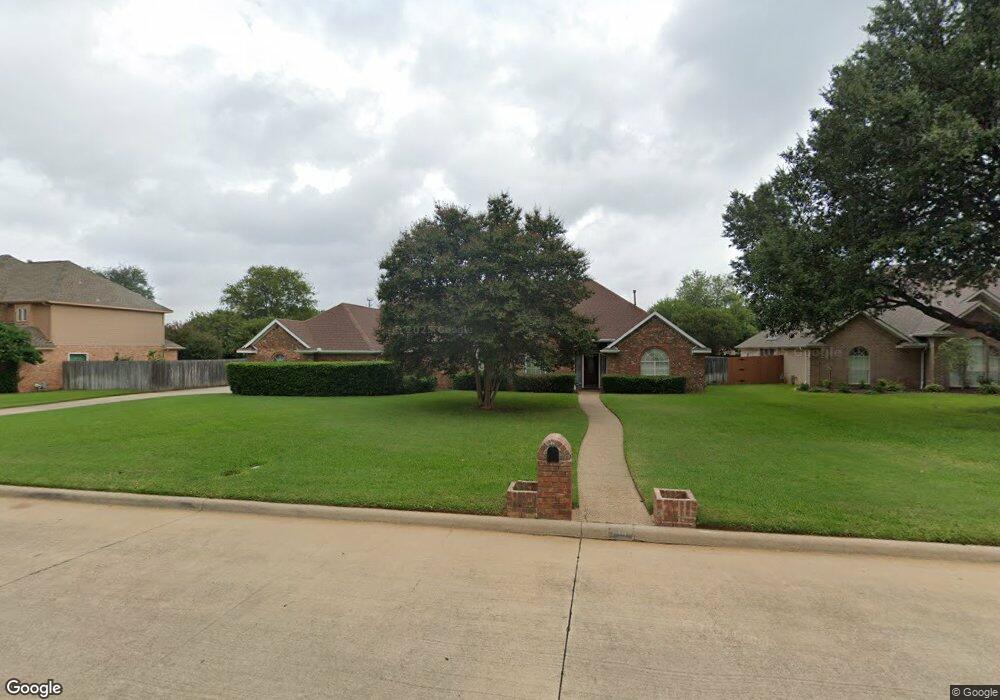
2402 Poplar Ct E Colleyville, TX 76034
Estimated Value: $729,962 - $908,000
4
Beds
3
Baths
2,541
Sq Ft
$320/Sq Ft
Est. Value
About This Home
This home is located at 2402 Poplar Ct E, Colleyville, TX 76034 and is currently estimated at $811,991, approximately $319 per square foot. 2402 Poplar Ct E is a home located in Tarrant County with nearby schools including O.C. Taylor Elementary School, Colleyville Middle School, and Waypoint Montessori.
Ownership History
Date
Name
Owned For
Owner Type
Purchase Details
Closed on
May 4, 2012
Sold by
Short Toni M and Short Anthony Kent
Bought by
Short Anthony K and Short Toni M
Current Estimated Value
Purchase Details
Closed on
Apr 14, 2004
Sold by
Twitchell Andrea B
Bought by
Short Anthony Kent and Short Toni M
Home Financials for this Owner
Home Financials are based on the most recent Mortgage that was taken out on this home.
Original Mortgage
$220,000
Outstanding Balance
$101,793
Interest Rate
5.42%
Mortgage Type
Purchase Money Mortgage
Estimated Equity
$710,198
Purchase Details
Closed on
Oct 24, 2000
Sold by
Baldwin Roy Dale and Baldwin Deborah Ann
Bought by
Twitchell Andrea B
Home Financials for this Owner
Home Financials are based on the most recent Mortgage that was taken out on this home.
Original Mortgage
$205,000
Interest Rate
7.89%
Create a Home Valuation Report for This Property
The Home Valuation Report is an in-depth analysis detailing your home's value as well as a comparison with similar homes in the area
Home Values in the Area
Average Home Value in this Area
Purchase History
| Date | Buyer | Sale Price | Title Company |
|---|---|---|---|
| Short Anthony K | -- | None Available | |
| Short Anthony Kent | -- | Fidelity Natl Title-Irving | |
| Twitchell Andrea B | -- | Allegiance Title Co |
Source: Public Records
Mortgage History
| Date | Status | Borrower | Loan Amount |
|---|---|---|---|
| Open | Short Anthony Kent | $220,000 | |
| Previous Owner | Twitchell Andrea B | $205,000 | |
| Closed | Short Anthony Kent | $55,000 | |
| Closed | Short Anthony K | $0 |
Source: Public Records
Tax History Compared to Growth
Tax History
| Year | Tax Paid | Tax Assessment Tax Assessment Total Assessment is a certain percentage of the fair market value that is determined by local assessors to be the total taxable value of land and additions on the property. | Land | Improvement |
|---|---|---|---|---|
| 2025 | $2,378 | $641,474 | $229,600 | $411,874 |
| 2024 | $2,378 | $641,474 | $229,600 | $411,874 |
| 2023 | $7,820 | $696,486 | $229,600 | $466,886 |
| 2022 | $9,533 | $590,299 | $229,600 | $360,699 |
| 2021 | $9,637 | $438,820 | $137,760 | $301,060 |
| 2020 | $10,485 | $475,518 | $137,760 | $337,758 |
| 2019 | $9,917 | $433,429 | $137,760 | $295,669 |
| 2018 | $2,318 | $389,944 | $95,000 | $294,944 |
| 2017 | $8,595 | $363,810 | $95,000 | $268,810 |
| 2016 | $7,916 | $358,178 | $95,000 | $263,178 |
| 2015 | $6,861 | $304,600 | $50,000 | $254,600 |
| 2014 | $6,861 | $304,600 | $50,000 | $254,600 |
Source: Public Records
Map
Nearby Homes
- 5504 Sycamore Dr
- 5404 Miramar Ln
- 5613 Versailles Ct
- 2906 Cottonwood Ln
- 4214 Hearthside Dr
- 4213 Hearthside Dr
- 2906 Edgewood Ln
- 3329 Moss Creek Dr
- 4282 Hearthside Dr
- 3216 Glade Rd
- 5508 Coventry Ct
- 3321 Circlewood Ct
- 1813 Grosvenor Green
- 4723 Bill Simmons Rd
- Lot 4 Amelia Ct
- 3278 Birch Ave
- 4816 Bill Simmons Rd
- 3904 Wagon Wheel Dr
- 2618 Pointe Ct
- 2602 Pointe Ct
- 2400 Poplar Ct E
- 2404 Poplar Ct E
- 2403 Spruce Ct
- 2405 Spruce Ct
- 2401 Spruce Ct
- 2406 Poplar Ct E
- 2403 Poplar Ct E
- 2401 Poplar Ct E
- 2405 Poplar Ct E
- 2407 Spruce Ct
- 2407 Poplar Ct E
- 5601 Poplar Ct W
- 5603 Poplar Ct W
- 5605 Poplar Ct W
- 2307 Poplar Ln
- 5504 Dusty Ct
- 5502 Dusty Ct
- 5506 Winding Trail
- 2402 Spruce Ct
- 2402 Arbor Trail