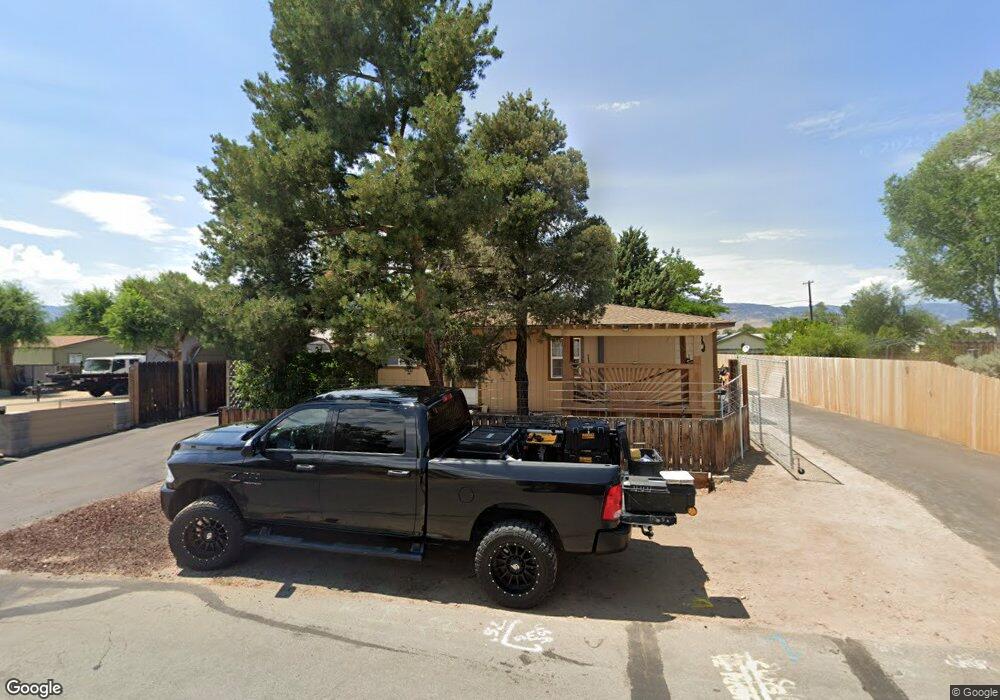
2402 Sneddon Way Carson City, NV 89706
New Empire NeighborhoodEstimated Value: $283,000 - $341,839
2
Beds
2
Baths
1,056
Sq Ft
$301/Sq Ft
Est. Value
About This Home
This home is located at 2402 Sneddon Way, Carson City, NV 89706 and is currently estimated at $318,280, approximately $301 per square foot. 2402 Sneddon Way is a home located in Carson City with nearby schools including John C. Fremont Elementary School, Eagle Valley Middle School, and Carson High School.
Ownership History
Date
Name
Owned For
Owner Type
Purchase Details
Closed on
Jan 4, 2021
Sold by
Perkins Robert B
Bought by
Perkins Nanette P
Current Estimated Value
Purchase Details
Closed on
Jul 26, 2010
Sold by
Paulson Nanette A
Bought by
White Bryce A
Home Financials for this Owner
Home Financials are based on the most recent Mortgage that was taken out on this home.
Original Mortgage
$66,400
Interest Rate
4.71%
Mortgage Type
New Conventional
Purchase Details
Closed on
Mar 17, 2005
Sold by
Kitson Linda S
Bought by
Paulson Nanette A
Home Financials for this Owner
Home Financials are based on the most recent Mortgage that was taken out on this home.
Original Mortgage
$168,000
Interest Rate
6.12%
Mortgage Type
New Conventional
Create a Home Valuation Report for This Property
The Home Valuation Report is an in-depth analysis detailing your home's value as well as a comparison with similar homes in the area
Home Values in the Area
Average Home Value in this Area
Purchase History
| Date | Buyer | Sale Price | Title Company |
|---|---|---|---|
| Perkins Nanette P | -- | None Available | |
| Perkins Nanette P | $180,000 | None Available | |
| White Bryce A | -- | None Available | |
| White Bryce A | $83,000 | Northern Nevada Title Cc | |
| Paulson Nanette A | $210,000 | Stewart Title Of Northern Nv |
Source: Public Records
Mortgage History
| Date | Status | Borrower | Loan Amount |
|---|---|---|---|
| Previous Owner | White Bryce A | $66,400 | |
| Previous Owner | Paulson Nanette A | $168,000 |
Source: Public Records
Tax History
| Year | Tax Paid | Tax Assessment Tax Assessment Total Assessment is a certain percentage of the fair market value that is determined by local assessors to be the total taxable value of land and additions on the property. | Land | Improvement |
|---|---|---|---|---|
| 2025 | $1,433 | $60,035 | $25,200 | $34,835 |
| 2024 | $1,023 | $47,602 | $25,200 | $22,402 |
| 2023 | $1,042 | $44,207 | $23,450 | $20,757 |
| 2022 | $965 | $36,768 | $18,200 | $18,568 |
| 2021 | $937 | $33,257 | $16,100 | $17,157 |
| 2019 | $877 | $28,498 | $12,250 | $16,248 |
| 2018 | $836 | $26,347 | $10,675 | $15,672 |
| 2017 | $803 | $25,635 | $10,150 | $15,485 |
| 2016 | $783 | $23,397 | $8,750 | $14,647 |
| 2015 | $781 | $22,899 | $8,453 | $14,446 |
| 2014 | $757 | $21,366 | $7,350 | $14,016 |
Source: Public Records
Map
Nearby Homes
- 3029 Sherman Ln
- 2524 Sneddon Way
- 2741 Bunch Way
- 2850 Airport Rd Unit 18
- 234 Gold Leaf Ln
- 2048 Poole Way
- 5 Riley Cir
- 34 Crown Point Dr
- 111 Kentuck Ln
- 3300 Woodside Dr Unit 6
- 3400 Woodside Dr Unit 23
- 1321 Ashby Ct
- 3115 Douglas Dr
- 1311 Siskiyou Dr
- 2613 Pinion Pine Dr
- 1329 Stanford Dr
- 1654 Spooner Dr
- 1316 Stanford Dr
- 1416 N Edmonds Dr Unit 1-4
- 1564 Truckee Dr
- 2380 Sneddon Way
- 2959 Sherman Ln
- 2901 Sherman Ln
- 2340 Sneddon Way
- 2379 Bunch Way
- 2320 Sneddon Way
- 2369 Bunch Way
- 2451 Sneddon Way
- 2455 Sneddon Way
- 2869 Sherman Ln
- 2459 Sneddon Way
- 2300 Sneddon Way
- 2730 Read Ct
- 2500 Sneddon Way
- 2510 Sneddon Way
- 2429 Bunch Way
- 2880 Sherman Ln
- 2359 Bunch Way
- 2501 Sneddon Way
- 2439 Bunch Way
Your Personal Tour Guide
Ask me questions while you tour the home.