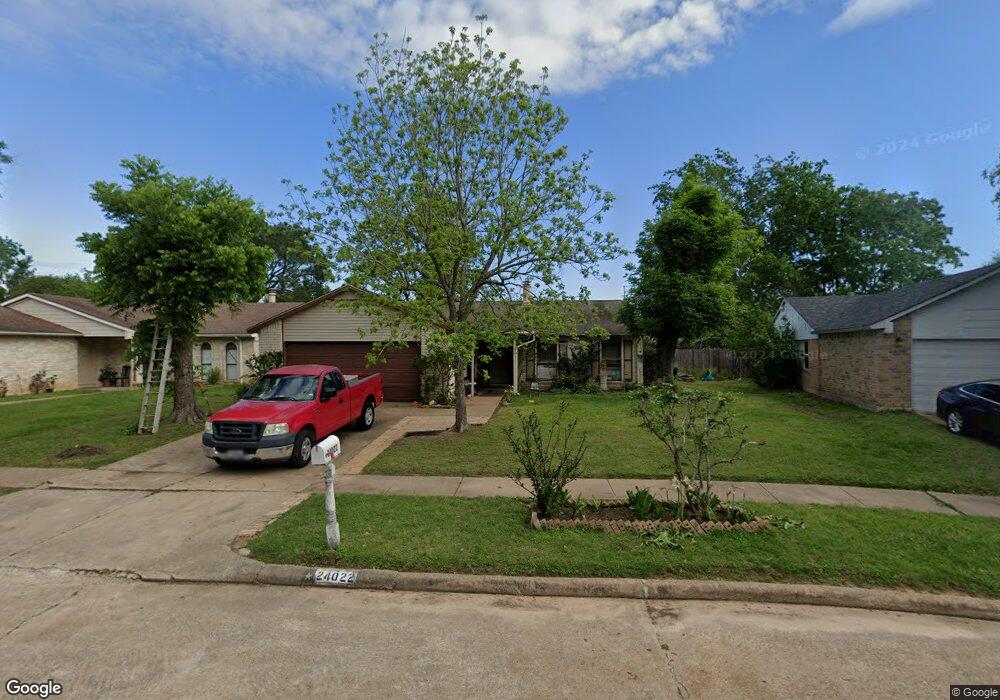
24022 Rockin Seven Dr Hockley, TX 77447
Hockley NeighborhoodEstimated Value: $204,000 - $235,000
3
Beds
2
Baths
1,664
Sq Ft
$134/Sq Ft
Est. Value
About This Home
This home is located at 24022 Rockin Seven Dr, Hockley, TX 77447 and is currently estimated at $223,171, approximately $134 per square foot. 24022 Rockin Seven Dr is a home located in Harris County with nearby schools including Roberts Road Elementary School, Waller Junior High School, and Waller High School.
Ownership History
Date
Name
Owned For
Owner Type
Purchase Details
Closed on
May 26, 2006
Sold by
Crain Dusty E and Crain Heather C
Bought by
Alexander Donald P and Alexander Nancy
Current Estimated Value
Home Financials for this Owner
Home Financials are based on the most recent Mortgage that was taken out on this home.
Original Mortgage
$10,000
Interest Rate
6.56%
Mortgage Type
Stand Alone Second
Purchase Details
Closed on
May 29, 1997
Sold by
Boswell Charles and Boswell Kay
Bought by
Crain Dusty E and Crain Heather C
Home Financials for this Owner
Home Financials are based on the most recent Mortgage that was taken out on this home.
Original Mortgage
$48,667
Interest Rate
8.17%
Mortgage Type
FHA
Purchase Details
Closed on
Aug 6, 1996
Sold by
Frappier Robert F
Bought by
Boswell Charles and Boswell Kay
Create a Home Valuation Report for This Property
The Home Valuation Report is an in-depth analysis detailing your home's value as well as a comparison with similar homes in the area
Home Values in the Area
Average Home Value in this Area
Purchase History
| Date | Buyer | Sale Price | Title Company |
|---|---|---|---|
| Alexander Donald P | -- | Guardian Fidelity Title | |
| Crain Dusty E | -- | Statewide Title Co | |
| Boswell Charles | $25,553 | -- |
Source: Public Records
Mortgage History
| Date | Status | Borrower | Loan Amount |
|---|---|---|---|
| Closed | Alexander Donald P | $10,000 | |
| Open | Alexander Donald P | $51,100 | |
| Previous Owner | Crain Dusty E | $48,667 |
Source: Public Records
Tax History Compared to Growth
Tax History
| Year | Tax Paid | Tax Assessment Tax Assessment Total Assessment is a certain percentage of the fair market value that is determined by local assessors to be the total taxable value of land and additions on the property. | Land | Improvement |
|---|---|---|---|---|
| 2025 | $5,277 | $229,593 | $35,372 | $194,221 |
| 2024 | $5,277 | $212,314 | $35,372 | $176,942 |
| 2023 | $5,277 | $227,318 | $35,372 | $191,946 |
| 2022 | $4,870 | $182,398 | $35,372 | $147,026 |
| 2021 | $4,517 | $161,560 | $28,940 | $132,620 |
| 2020 | $4,178 | $144,726 | $27,333 | $117,393 |
| 2019 | $3,582 | $120,000 | $22,509 | $97,491 |
| 2018 | $3,090 | $103,500 | $22,509 | $80,991 |
| 2017 | $3,059 | $108,721 | $22,509 | $86,212 |
| 2016 | $2,861 | $96,817 | $22,509 | $74,308 |
| 2015 | $1,042 | $88,996 | $15,435 | $73,561 |
| 2014 | $1,042 | $58,857 | $15,435 | $43,422 |
Source: Public Records
Map
Nearby Homes
- 17419 Lavender Blossom Ln
- 17423 Lavender Blossom Ln
- 17503 Lavender Blossom Ln
- 24039 Rockin Seven Dr
- 17607 Lavender Blossom Ln
- 32115 Waterlily View Ct
- 32103 Sweet Pea Meadows Dr
- Tyler Plan at Dellrose
- Cypress Plan at Dellrose
- Edison Plan at Dellrose
- Dawson Plan at Dellrose
- Hyde Plan at Dellrose
- Cheyenne Plan at Dellrose
- Avery Plan at Dellrose
- Katy Plan at Dellrose
- 32114 Sweet Pea Meadows Dr
- 32123 Sweet Pea Meadows Dr
- 32135 Sweet Pea Meadows Dr
- 17506 Bullis Gap Dr
- 17603 Lavender Blossom Ln
- 24026 Rockin Seven Dr
- 24018 Rockin Seven Dr
- 24023 Broken Bow Ln
- 24027 Broken Bow Ln
- 24030 Rockin Seven Dr
- 24019 Broken Bow Ln
- 24014 Rockin Seven Dr
- 24031 Broken Bow Ln
- 24023 Rockin Seven Dr
- 24027 Rockin Seven Dr
- 24034 Rockin Seven Dr
- 24015 Broken Bow Ln
- 24010 Rockin Seven Dr
- 24031 Rockin Seven Dr
- 24103 Broken Bow Ln
- 24038 Rockin Seven Dr
- 24035 Rockin Seven Dr
- 24022 Broken Bow Ln
- 24006 Rockin Seven Dr
- 24107 Broken Bow Ln