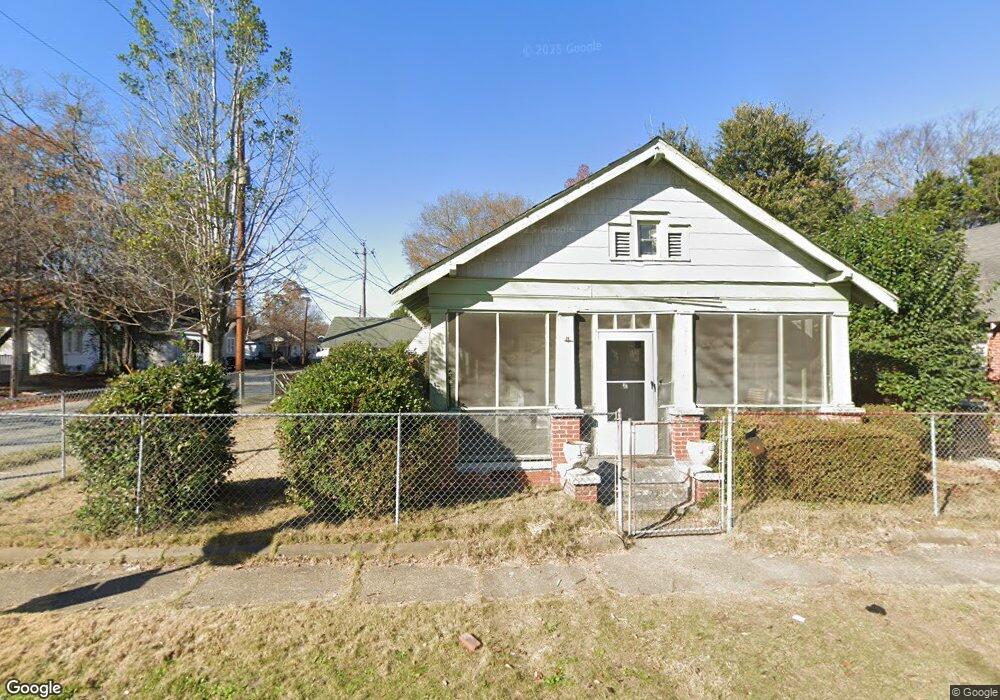
2403 Gould St Columbus, GA 31906
East Wynnton-Wynnton Hill NeighborhoodEstimated Value: $60,091 - $117,000
3
Beds
2
Baths
1,203
Sq Ft
$65/Sq Ft
Est. Value
About This Home
Property Id: 1596512
A bundle of 2 beautiful houses you and your kids can call home. In a quiet neighborhood. Central Air Conditioning and Heat available. Off start parking.
Ownership History
Date
Name
Owned For
Owner Type
Purchase Details
Closed on
May 7, 2024
Sold by
Jones Teresa and Smith Michele
Bought by
Ahmed Osman
Current Estimated Value
Purchase Details
Closed on
Aug 8, 2023
Sold by
Jones Essie
Bought by
Jones Teresa and Smith Michele
Purchase Details
Closed on
Jul 19, 2015
Sold by
Kelley Johnette Mounds
Bought by
Jones Essie
Create a Home Valuation Report for This Property
The Home Valuation Report is an in-depth analysis detailing your home's value as well as a comparison with similar homes in the area
Home Values in the Area
Average Home Value in this Area
Purchase History
| Date | Buyer | Sale Price | Title Company |
|---|---|---|---|
| Ahmed Osman | $20,000 | None Listed On Document | |
| Jones Teresa | -- | None Listed On Document | |
| Jones Essie | -- | -- |
Source: Public Records
Property History
| Date | Event | Price | List to Sale | Price per Sq Ft |
|---|---|---|---|---|
| 10/11/2025 10/11/25 | Off Market | $1,000 | -- | -- |
| 09/24/2025 09/24/25 | For Rent | $1,000 | 0.0% | -- |
| 09/12/2024 09/12/24 | For Rent | $1,000 | -- | -- |
Tax History Compared to Growth
Tax History
| Year | Tax Paid | Tax Assessment Tax Assessment Total Assessment is a certain percentage of the fair market value that is determined by local assessors to be the total taxable value of land and additions on the property. | Land | Improvement |
|---|---|---|---|---|
| 2025 | $1,662 | $42,452 | $3,552 | $38,900 |
| 2024 | $1,027 | $26,232 | $3,552 | $22,680 |
| 2023 | $0 | $26,232 | $3,552 | $22,680 |
| 2022 | $4 | $21,596 | $3,552 | $18,044 |
| 2021 | $4 | $21,596 | $3,552 | $18,044 |
| 2020 | $4 | $21,596 | $3,552 | $18,044 |
| 2019 | $4 | $21,596 | $3,552 | $18,044 |
| 2018 | $4 | $21,596 | $3,552 | $18,044 |
| 2017 | $927 | $21,596 | $3,552 | $18,044 |
| 2016 | $548 | $13,280 | $1,725 | $11,555 |
| 2015 | $2 | $13,280 | $1,725 | $11,555 |
| 2014 | $2 | $13,280 | $1,725 | $11,555 |
| 2013 | -- | $13,280 | $1,725 | $11,555 |
Source: Public Records
Map
Nearby Homes