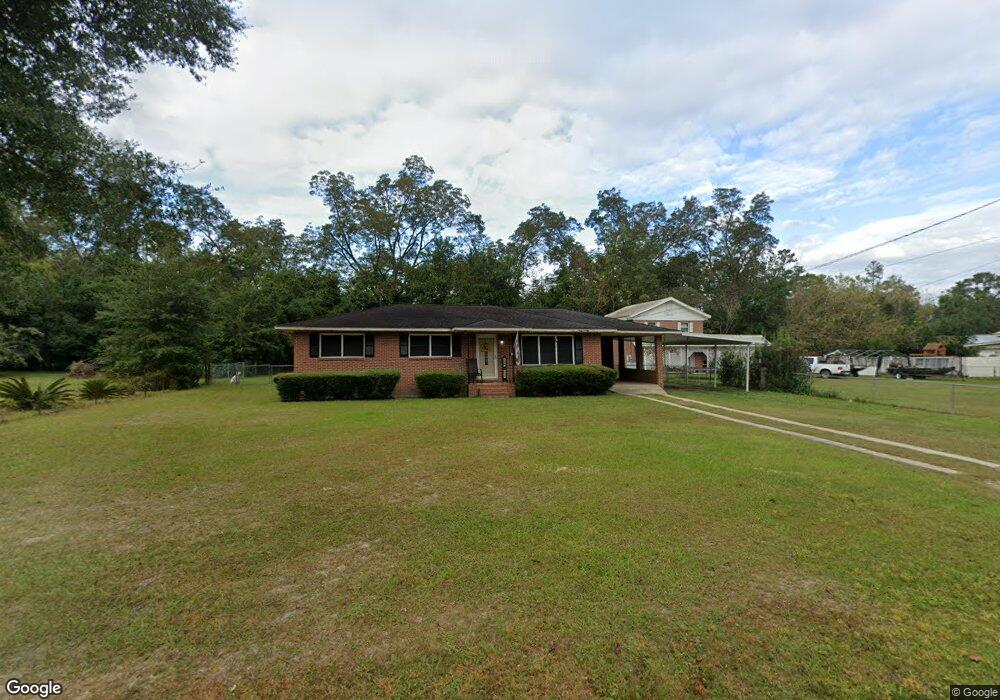
2403 Manchester St Waycross, GA 31501
Estimated Value: $141,321 - $166,000
3
Beds
2
Baths
1,410
Sq Ft
$109/Sq Ft
Est. Value
About This Home
This home is located at 2403 Manchester St, Waycross, GA 31501 and is currently estimated at $154,080, approximately $109 per square foot. 2403 Manchester St is a home located in Ware County with nearby schools including Center Elementary School, Waycross Middle School, and Ware County High School.
Ownership History
Date
Name
Owned For
Owner Type
Purchase Details
Closed on
Jan 5, 2018
Sold by
Monk Jenna M
Bought by
Mcveigh Curtis W
Current Estimated Value
Purchase Details
Closed on
Mar 27, 2013
Sold by
Gallagher David J
Bought by
Monk Jenna M
Home Financials for this Owner
Home Financials are based on the most recent Mortgage that was taken out on this home.
Original Mortgage
$68,732
Interest Rate
3.75%
Mortgage Type
FHA
Purchase Details
Closed on
Oct 9, 2012
Sold by
Carter Bruce A
Bought by
Gallagher David J
Purchase Details
Closed on
Aug 17, 2006
Sold by
Bryars Mark Yancy
Bought by
Carter Bruce A and Carter Ginnie G
Home Financials for this Owner
Home Financials are based on the most recent Mortgage that was taken out on this home.
Original Mortgage
$87,746
Interest Rate
6.73%
Mortgage Type
VA
Purchase Details
Closed on
May 3, 2005
Sold by
Jarrard Herbert T
Bought by
Bryars Mark Yancy
Purchase Details
Closed on
Apr 1, 1995
Bought by
Jarrard Herbert and Jarrard Br
Create a Home Valuation Report for This Property
The Home Valuation Report is an in-depth analysis detailing your home's value as well as a comparison with similar homes in the area
Home Values in the Area
Average Home Value in this Area
Purchase History
| Date | Buyer | Sale Price | Title Company |
|---|---|---|---|
| Mcveigh Curtis W | $76,000 | -- | |
| Monk Jenna M | $70,000 | -- | |
| Gallagher David J | -- | -- | |
| Carter Bruce A | $85,900 | -- | |
| Bryars Mark Yancy | $37,600 | -- | |
| Jarrard Herbert | $34,000 | -- |
Source: Public Records
Mortgage History
| Date | Status | Borrower | Loan Amount |
|---|---|---|---|
| Previous Owner | Monk Jenna M | $68,732 | |
| Previous Owner | Carter Bruce A | $87,746 |
Source: Public Records
Tax History Compared to Growth
Tax History
| Year | Tax Paid | Tax Assessment Tax Assessment Total Assessment is a certain percentage of the fair market value that is determined by local assessors to be the total taxable value of land and additions on the property. | Land | Improvement |
|---|---|---|---|---|
| 2024 | $1,202 | $44,002 | $2,040 | $41,962 |
| 2023 | $1,132 | $50,934 | $1,600 | $49,334 |
| 2022 | $1,471 | $50,934 | $1,600 | $49,334 |
| 2021 | $1,213 | $38,670 | $1,600 | $37,070 |
| 2020 | $1,189 | $37,485 | $1,600 | $35,885 |
| 2019 | $983 | $31,560 | $1,600 | $29,960 |
| 2018 | $991 | $30,375 | $1,600 | $28,775 |
| 2017 | $990 | $30,375 | $1,600 | $28,775 |
| 2016 | $990 | $30,375 | $1,600 | $28,775 |
| 2015 | $1,000 | $30,375 | $1,600 | $28,775 |
| 2014 | $920 | $30,375 | $1,600 | $28,775 |
| 2013 | -- | $30,375 | $1,600 | $28,775 |
Source: Public Records
Map
Nearby Homes
- 1013 E Waring St
- 2123 Sunnyside Dr
- 2099 Ridge Rd
- 904 Golfview Dr
- 2784 Autumn Ridge Ln
- 2312 Spurgeon St
- 601 Community Dr
- 607 Linden Dr
- 2509 Tebeau St
- 515 Summit St
- 705 E Waring St
- 404 Community Dr
- 2706 Alice St
- 6435 Riverwoods Dr
- 2120 Tebeau St
- 2202 Pioneer St
- 1301 Riverside Ave
- 2022 Pioneer St
- 00 Pineview Dr
- 0 Pineview Dr
- 2405 Manchester St
- 2313 Manchester St
- 2400 Manchester St
- 2407 Manchester St
- 2402 Manchester St
- 2306 Manchester St
- 2311 Manchester St
- 2409 Manchester St
- 2304 Manchester St
- 2406 Manchester St
- 1105 Dover St
- 1102 Dover St
- 2309 Manchester St
- 2302 Manchester St
- 1104 Dover St
- 1101 Crosby St
- 1009 1/2 E Waring St
- 2307 Manchester St
- 2505 Sunnyside Dr
- 1103 Crosby St