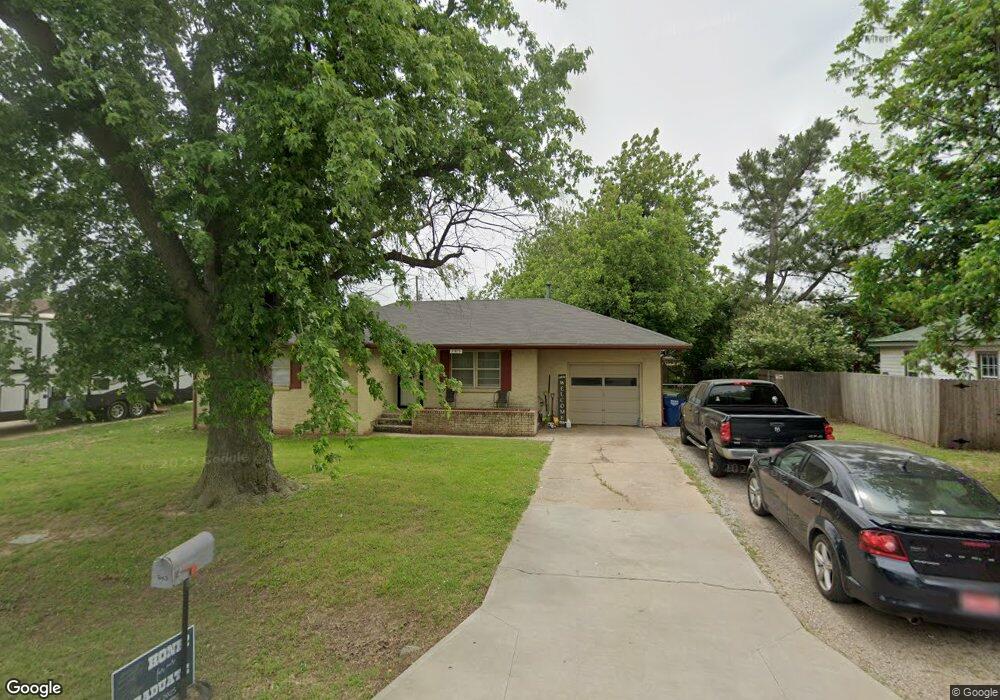
2403 Townsend Dr El Reno, OK 73036
Estimated Value: $112,000 - $156,000
2
Beds
1
Bath
1,090
Sq Ft
$129/Sq Ft
Est. Value
About This Home
This home is located at 2403 Townsend Dr, El Reno, OK 73036 and is currently estimated at $140,457, approximately $128 per square foot. 2403 Townsend Dr is a home located in Canadian County with nearby schools including Hillcrest Elementary School, Rose Witcher Elementary School, and Lincoln Learning Center.
Ownership History
Date
Name
Owned For
Owner Type
Purchase Details
Closed on
May 30, 2003
Sold by
Goodman Scott R and Goodman Kristi D
Bought by
Gilliland Jeff and Gilliland Stacey
Current Estimated Value
Home Financials for this Owner
Home Financials are based on the most recent Mortgage that was taken out on this home.
Original Mortgage
$56,056
Outstanding Balance
$24,484
Interest Rate
5.74%
Estimated Equity
$115,973
Purchase Details
Closed on
Mar 15, 1999
Sold by
Burris Leslie
Purchase Details
Closed on
Oct 13, 1998
Sold by
Sec Housing & Urban Dev
Purchase Details
Closed on
Apr 20, 1998
Sold by
Sheriff (Muir)
Purchase Details
Closed on
Mar 4, 1996
Sold by
Tate June A
Purchase Details
Closed on
May 19, 1993
Sold by
Carnott Christine L
Purchase Details
Closed on
Jul 30, 1992
Sold by
Conversion
Purchase Details
Closed on
Jul 17, 1992
Purchase Details
Closed on
Jun 7, 1991
Create a Home Valuation Report for This Property
The Home Valuation Report is an in-depth analysis detailing your home's value as well as a comparison with similar homes in the area
Home Values in the Area
Average Home Value in this Area
Purchase History
| Date | Buyer | Sale Price | Title Company |
|---|---|---|---|
| Gilliland Jeff | $56,500 | -- | |
| -- | $48,500 | -- | |
| -- | -- | -- | |
| -- | -- | -- | |
| -- | $33,000 | -- | |
| -- | $29,000 | -- | |
| -- | $24,500 | -- | |
| -- | $8,000 | -- | |
| -- | -- | -- |
Source: Public Records
Mortgage History
| Date | Status | Borrower | Loan Amount |
|---|---|---|---|
| Open | Gilliland Jeff | $56,056 |
Source: Public Records
Tax History Compared to Growth
Tax History
| Year | Tax Paid | Tax Assessment Tax Assessment Total Assessment is a certain percentage of the fair market value that is determined by local assessors to be the total taxable value of land and additions on the property. | Land | Improvement |
|---|---|---|---|---|
| 2024 | $768 | $8,417 | $1,170 | $7,247 |
| 2023 | $768 | $8,172 | $1,170 | $7,002 |
| 2022 | $746 | $7,934 | $1,170 | $6,764 |
| 2021 | $738 | $7,703 | $1,170 | $6,533 |
| 2020 | $705 | $7,479 | $1,170 | $6,309 |
| 2019 | $712 | $7,261 | $1,170 | $6,091 |
| 2018 | $681 | $7,049 | $1,170 | $5,879 |
| 2017 | $671 | $6,844 | $1,170 | $5,674 |
| 2016 | $652 | $6,844 | $1,170 | $5,674 |
| 2015 | $599 | $6,451 | $1,170 | $5,281 |
| 2014 | $599 | $6,264 | $1,170 | $5,094 |
Source: Public Records
Map
Nearby Homes
- 404 N Park St
- 2452 Stone Glen Dr
- 2500 Kadlan Dr
- 0 Sabra Pass
- 1501 W Watts St
- 1705 Vermilion Ln
- 2401 Scarlet Ln
- 1713 Vermilion Ln
- 1505 W Shuttee St
- 0 Magnolia Handley Unit 1178760
- 1200 Sunset Dr
- 601 S Fillmore Ave
- 116 N Mahan Ave
- 1312 W Shuttee St
- 1108 W Hayes St
- 1524 W Oak St
- 1905 W Elm St
- 1117 W London St
- 508 S Morrison Ave
- 710 Sunset Dr
- 2401 Townsend Dr
- 2405 Townsend Dr
- 2402 Townsend Dr
- 2407 Townsend Dr
- 2404 Townsend Dr
- 2400 Stone Glen Dr
- 2400 Townsend Dr
- 2404 Stone Glen Dr
- 2408 Stone Glen Dr
- 2406 Townsend Dr
- 2409 Townsend Dr
- 2412 Stone Glen Dr
- 2408 Townsend Dr
- 2411 Townsend Dr
- 405 N Park St
- 2416 Stone Glen Dr
- 2410 Townsend Dr
- 2405 Stone Glen Dr
- 2409 Stone Glen Dr
- 2420 Stone Glen Dr