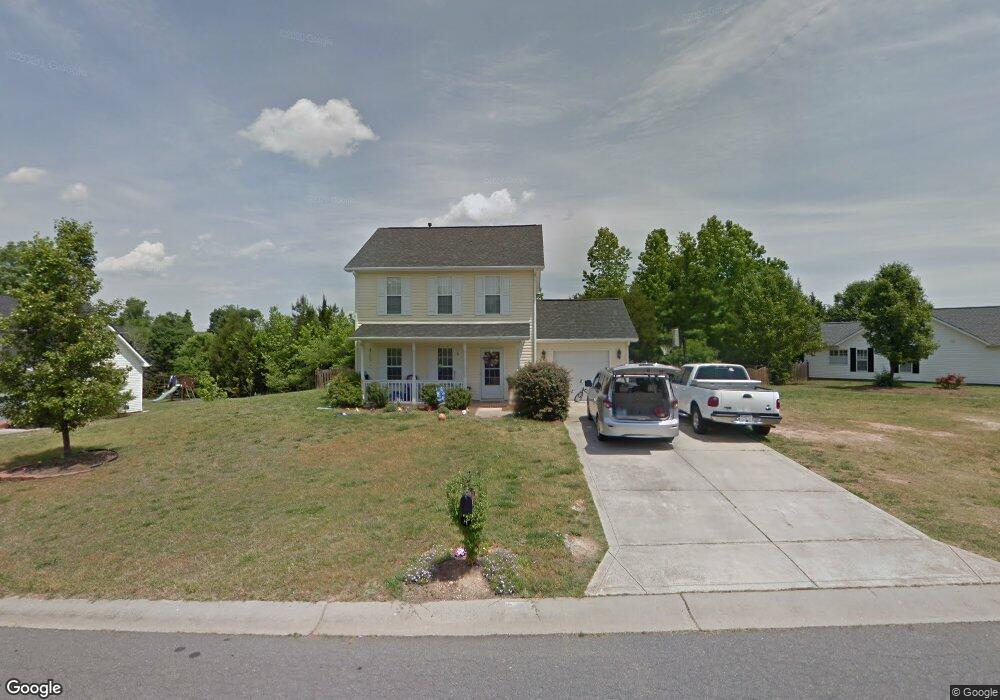
2404 Ivy Run Dr Unit 45 Indian Trail, NC 28079
Estimated Value: $326,103 - $382,000
3
Beds
3
Baths
1,344
Sq Ft
$268/Sq Ft
Est. Value
About This Home
This home is located at 2404 Ivy Run Dr Unit 45, Indian Trail, NC 28079 and is currently estimated at $360,776, approximately $268 per square foot. 2404 Ivy Run Dr Unit 45 is a home located in Union County with nearby schools including Fairview Elementary School, Piedmont Middle School, and Piedmont High School.
Ownership History
Date
Name
Owned For
Owner Type
Purchase Details
Closed on
Jul 13, 2019
Sold by
Alexander Stephen D and Alexander Monica E
Bought by
Sfr Jv 1 Property Llc
Current Estimated Value
Purchase Details
Closed on
Aug 11, 2016
Sold by
Thomas Christopher E and Thomas Catherine C
Bought by
Alexander Stephen D and Alexander Monica E
Home Financials for this Owner
Home Financials are based on the most recent Mortgage that was taken out on this home.
Original Mortgage
$162,011
Interest Rate
3.25%
Mortgage Type
FHA
Purchase Details
Closed on
Nov 30, 1999
Sold by
Garry D Smith Homes Inc
Bought by
Thomas Christopher E and Thomas Catherine C
Home Financials for this Owner
Home Financials are based on the most recent Mortgage that was taken out on this home.
Original Mortgage
$105,107
Interest Rate
7.89%
Mortgage Type
FHA
Create a Home Valuation Report for This Property
The Home Valuation Report is an in-depth analysis detailing your home's value as well as a comparison with similar homes in the area
Home Values in the Area
Average Home Value in this Area
Purchase History
| Date | Buyer | Sale Price | Title Company |
|---|---|---|---|
| Sfr Jv 1 Property Llc | $195,000 | None Available | |
| Alexander Stephen D | $165,000 | None Available | |
| Thomas Christopher E | $107,000 | -- |
Source: Public Records
Mortgage History
| Date | Status | Borrower | Loan Amount |
|---|---|---|---|
| Previous Owner | Alexander Stephen D | $162,011 | |
| Previous Owner | Thomas Christopher E | $105,107 |
Source: Public Records
Tax History Compared to Growth
Tax History
| Year | Tax Paid | Tax Assessment Tax Assessment Total Assessment is a certain percentage of the fair market value that is determined by local assessors to be the total taxable value of land and additions on the property. | Land | Improvement |
|---|---|---|---|---|
| 2025 | $1,617 | $339,000 | $0 | $0 |
| 2024 | $1,423 | $222,600 | $41,800 | $180,800 |
| 2023 | $1,407 | $222,600 | $41,800 | $180,800 |
| 2022 | $1,407 | $222,600 | $41,800 | $180,800 |
| 2021 | $1,407 | $222,600 | $41,800 | $180,800 |
| 2020 | $1,066 | $136,800 | $25,000 | $111,800 |
| 2019 | $1,067 | $136,800 | $25,000 | $111,800 |
| 2018 | $1,067 | $136,800 | $25,000 | $111,800 |
| 2017 | $1,137 | $136,800 | $25,000 | $111,800 |
| 2016 | $1,115 | $136,800 | $25,000 | $111,800 |
| 2015 | $1,132 | $136,800 | $25,000 | $111,800 |
| 2014 | $988 | $138,320 | $35,000 | $103,320 |
Source: Public Records
Map
Nearby Homes
- 2332 Ivy Run Dr
- 2501 Ivy Run Dr
- 0 Cunningham Ln
- 7316 Cunningham Ln
- 16116 Deepwood Place
- 468 Sunharvest Ln
- 4009 Grace Pointe Dr
- 8105 Indian Trail Fairview Rd
- 7004 Paddle Wheel Ln Unit 696
- 2318 Lawyers Rd W
- 5014 Scaleybark Ct
- 5020 Scaleybark Ct
- 4004 Chimney Wood Trail
- 3114 Less Traveled Trail
- 15901 Lawyers Rd
- 6520 Bridgemoor Dr
- 1009 Atherton Dr
- 4012 Crismark Dr
- 3108 Leicester Dr
- 2006 Bikar Ct
- 2404 Ivy Run Dr
- 2404 Ivy Run Dr
- 2408 Ivy Run Dr
- 2332 Ivy Run Dr Unit 44
- 2407 Ivy Run Dr
- 2410 Ivy Run Dr
- 2328 Ivy Run Dr
- 2403 Ivy Run Dr
- 7001 Shiney Bark Ct
- 2409 Ivy Run Dr
- 2326 Ivy Run Dr
- 2412 Ivy Run Dr
- 7000 Shiney Bark Ct
- 6906 Dandelion Ct
- 6905 Dandelion Ct
- 2411 Ivy Run Dr
- 2331 Ivy Run Dr
- 2324 Ivy Run Dr
- 2329 Ivy Run Dr
- 7003 Shiney Bark Ct