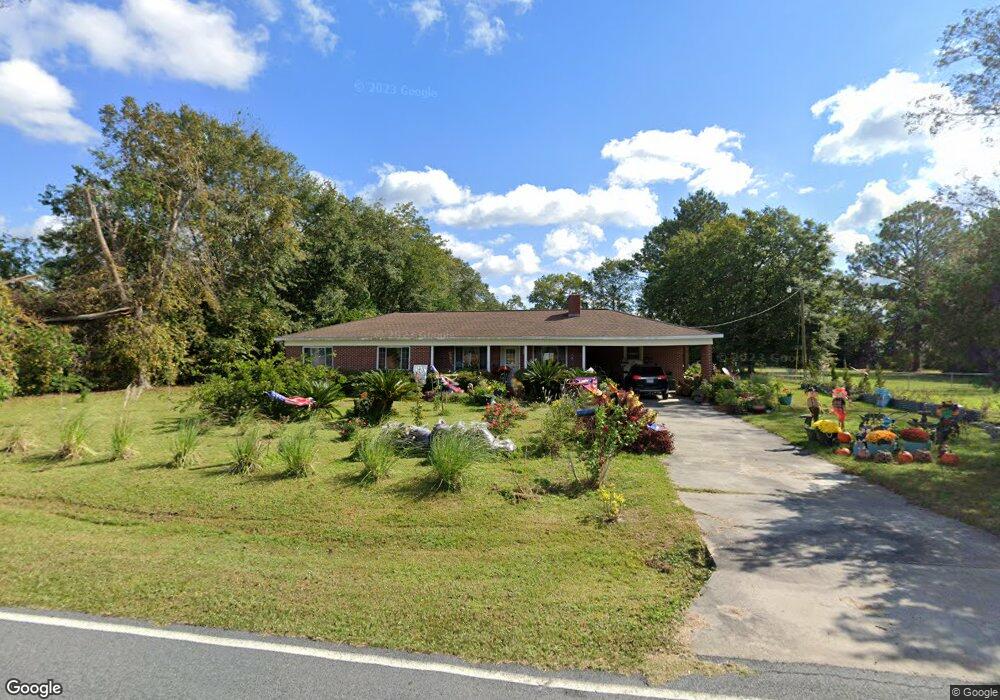
2404 Monroe St Waycross, GA 31501
Estimated Value: $145,000 - $221,000
3
Beds
2
Baths
1,619
Sq Ft
$120/Sq Ft
Est. Value
About This Home
This home is located at 2404 Monroe St, Waycross, GA 31501 and is currently estimated at $194,566, approximately $120 per square foot. 2404 Monroe St is a home located in Ware County with nearby schools including Center Elementary School, Waycross Middle School, and Ware County High School.
Ownership History
Date
Name
Owned For
Owner Type
Purchase Details
Closed on
Jun 13, 2022
Sold by
Granite Way Investments Inc
Bought by
Edwards Richard A and Grover Cynthia A
Current Estimated Value
Home Financials for this Owner
Home Financials are based on the most recent Mortgage that was taken out on this home.
Original Mortgage
$147,200
Outstanding Balance
$107,594
Interest Rate
5.3%
Mortgage Type
Mortgage Modification
Estimated Equity
$86,972
Purchase Details
Closed on
May 23, 2018
Sold by
Carney William Edgar
Bought by
Granite Way Investments Inc
Purchase Details
Closed on
Jan 15, 2018
Sold by
Adams Jaret Daniel
Bought by
Carney William Edgar and Carney Elaine S
Purchase Details
Closed on
Jan 14, 1999
Sold by
Smith Shelton B and Smith Ma
Bought by
Adams Jaret and Adams Amanda
Purchase Details
Closed on
Jan 13, 1999
Sold by
Vining Sylvia M
Bought by
Smith Shelton B and Smith Ma
Purchase Details
Closed on
Dec 5, 1994
Bought by
Smith Shelton B and Smith Ma
Create a Home Valuation Report for This Property
The Home Valuation Report is an in-depth analysis detailing your home's value as well as a comparison with similar homes in the area
Home Values in the Area
Average Home Value in this Area
Purchase History
| Date | Buyer | Sale Price | Title Company |
|---|---|---|---|
| Edwards Richard A | $184,000 | -- | |
| Granite Way Investments Inc | -- | -- | |
| Carney William Edgar | $115,000 | -- | |
| Adams Jaret | $69,900 | -- | |
| Smith Shelton B | -- | -- | |
| Smith Shelton B | $55,500 | -- |
Source: Public Records
Mortgage History
| Date | Status | Borrower | Loan Amount |
|---|---|---|---|
| Open | Edwards Richard A | $147,200 |
Source: Public Records
Tax History Compared to Growth
Tax History
| Year | Tax Paid | Tax Assessment Tax Assessment Total Assessment is a certain percentage of the fair market value that is determined by local assessors to be the total taxable value of land and additions on the property. | Land | Improvement |
|---|---|---|---|---|
| 2024 | $1,490 | $88,294 | $10,488 | $77,806 |
| 2023 | $1,519 | $65,195 | $4,784 | $60,411 |
| 2022 | $1,908 | $66,077 | $4,784 | $61,293 |
| 2021 | $1,657 | $52,843 | $4,784 | $48,059 |
| 2020 | $1,565 | $49,353 | $4,784 | $44,569 |
| 2019 | $1,538 | $48,190 | $4,784 | $43,406 |
| 2018 | $1,479 | $45,322 | $3,458 | $41,864 |
| 2017 | $1,478 | $45,322 | $3,458 | $41,864 |
| 2016 | $1,478 | $45,322 | $3,458 | $41,864 |
| 2015 | $1,279 | $45,322 | $3,458 | $41,864 |
| 2014 | $1,277 | $45,322 | $3,458 | $41,864 |
| 2013 | -- | $45,322 | $3,458 | $41,864 |
Source: Public Records
Map
Nearby Homes
- 416 Cherokee Ave
- 401 Union St
- 420 Cherokee Ave
- 403 Union St
- 421 Cherokee Ave
- 417 Cherokee Ave
- 409 Union St
- 402 Cherokee Ave
- 400 Union St
- 404 Union St
- 406 Cherokee Ave
- 410&412 Cherokee Ave
- 410 Cherokee Ave
- 412 Cherokee Ave
- 412 1/2 Cherokee Ave
- 354 Cherokee Ave
- 412 Union St
- 403 Cherokee Ave
- 414 Cherokee Ave
- 501 Union St