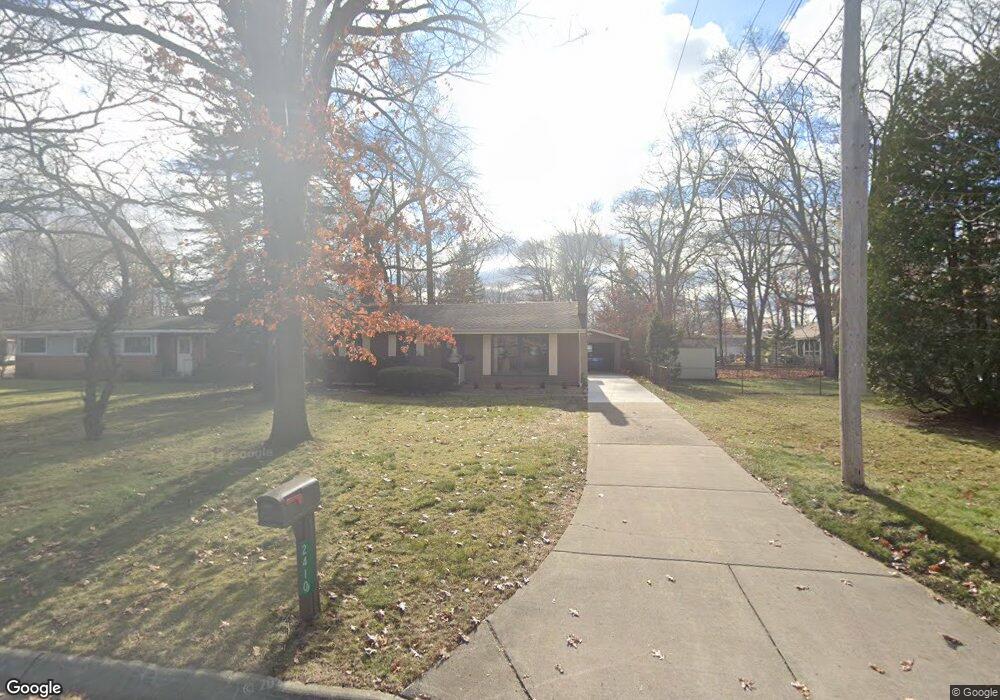
2404 Sanborn St Port Huron, MI 48060
Estimated Value: $219,985 - $243,000
3
Beds
2
Baths
1,216
Sq Ft
$193/Sq Ft
Est. Value
About This Home
This home is located at 2404 Sanborn St, Port Huron, MI 48060 and is currently estimated at $235,246, approximately $193 per square foot. 2404 Sanborn St is a home located in St. Clair County with nearby schools including H.D. Crull Elementary School, Holland Woods Middle School, and Port Huron Northern High School.
Ownership History
Date
Name
Owned For
Owner Type
Purchase Details
Closed on
Sep 27, 2022
Sold by
Rock Justin
Bought by
Rock Bethany
Current Estimated Value
Home Financials for this Owner
Home Financials are based on the most recent Mortgage that was taken out on this home.
Original Mortgage
$66,800
Outstanding Balance
$64,562
Interest Rate
6.7%
Mortgage Type
New Conventional
Estimated Equity
$170,684
Purchase Details
Closed on
Aug 17, 2011
Sold by
Prince Carol L
Bought by
Rock Bethany and Rock Justin
Home Financials for this Owner
Home Financials are based on the most recent Mortgage that was taken out on this home.
Original Mortgage
$85,749
Interest Rate
4.5%
Mortgage Type
FHA
Purchase Details
Closed on
Jan 7, 2010
Sold by
Halliday Virginia R
Bought by
Prince Carol L
Purchase Details
Closed on
Sep 5, 2008
Sold by
Halliday Virginia R and Earl Halliday S
Bought by
Halliday Virginia R and S Earl Halliday & Virginia R Halliday Re
Create a Home Valuation Report for This Property
The Home Valuation Report is an in-depth analysis detailing your home's value as well as a comparison with similar homes in the area
Home Values in the Area
Average Home Value in this Area
Purchase History
| Date | Buyer | Sale Price | Title Company |
|---|---|---|---|
| Rock Bethany | -- | Huron Title | |
| Rock Bethany | $94,900 | None Available | |
| Prince Carol L | -- | None Available | |
| Halliday Virginia R | -- | None Available |
Source: Public Records
Mortgage History
| Date | Status | Borrower | Loan Amount |
|---|---|---|---|
| Open | Rock Bethany | $66,800 | |
| Previous Owner | Rock Bethany | $85,749 |
Source: Public Records
Tax History Compared to Growth
Tax History
| Year | Tax Paid | Tax Assessment Tax Assessment Total Assessment is a certain percentage of the fair market value that is determined by local assessors to be the total taxable value of land and additions on the property. | Land | Improvement |
|---|---|---|---|---|
| 2025 | $2,548 | $93,600 | $0 | $0 |
| 2024 | $2,185 | $91,100 | $0 | $0 |
| 2023 | $2,064 | $83,100 | $0 | $0 |
| 2022 | $2,189 | $75,200 | $0 | $0 |
| 2021 | $2,078 | $70,700 | $0 | $0 |
| 2020 | $2,101 | $62,400 | $62,400 | $0 |
| 2019 | $2,064 | $48,500 | $0 | $0 |
| 2018 | $2,018 | $48,500 | $0 | $0 |
| 2017 | $1,801 | $48,600 | $0 | $0 |
| 2016 | $1,544 | $48,600 | $0 | $0 |
| 2015 | $1,515 | $46,800 | $46,800 | $0 |
| 2014 | $1,515 | $45,900 | $45,900 | $0 |
| 2013 | -- | $41,600 | $0 | $0 |
Source: Public Records
Map
Nearby Homes
- 3208 Mount Vernon Rd
- 3419 Riverside Dr
- 2857 Riverside Dr
- 2835 17th Ave
- 2812 19th Ave
- 3515 Strawberry Ln
- 1531 Robinson St
- 1424 Hazelwood Ln
- 2913 11th Ave
- 3196 Oakwood Dr
- 1434 Schumaker St
- 2806 Woodstock Dr
- 3214 Poplar St
- 2549 Riverwood Dr
- 1202 Palmer Ct
- 3321 Stone St
- 2610 Strawberry Ln
- 1020 Sanborn St
- 1218 Garfield St
- 2838 Elmwood St
- 2410 Sanborn St
- 3241 Monticello Dr
- 3235 Monticello Dr
- 3242 Monticello Dr
- 3236 Monticello Dr
- 2314 Sanborn St
- 3227 Monticello Dr
- 3221 Monticello Dr
- 3226 Monticello Dr
- 3256 Riverside Dr
- 2403 Sanborn St
- 2409 Sanborn St
- 3228 Riverside Dr
- 3250 Riverside Dr
- 3244 Riverside Dr
- 2319 Sanborn St
- 3236 Riverside Dr
- 2304 Sanborn St
- 3274 Riverside Dr
- 3241 Hickory Ln