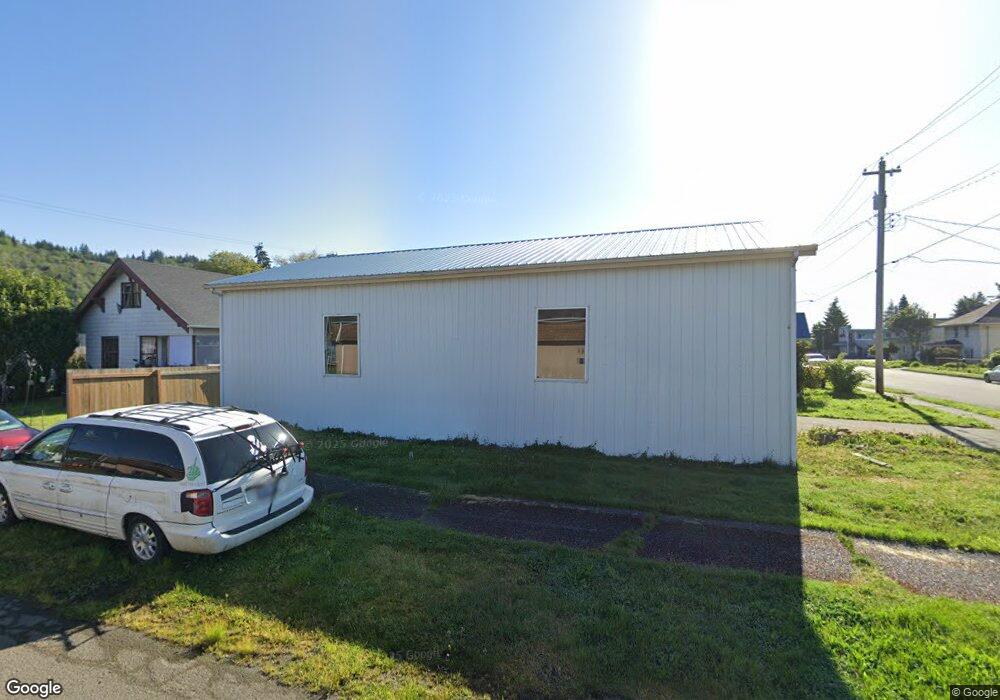
2405 Aberdeen Ave Hoquiam, WA 98550
Ontario NeighborhoodEstimated Value: $219,000 - $272,000
3
Beds
1
Bath
1,440
Sq Ft
$176/Sq Ft
Est. Value
About This Home
This home is located at 2405 Aberdeen Ave, Hoquiam, WA 98550 and is currently estimated at $253,007, approximately $175 per square foot. 2405 Aberdeen Ave is a home located in Grays Harbor County with nearby schools including Lincoln Elementary School, Emerson Elementary School, and Central Elementary School.
Ownership History
Date
Name
Owned For
Owner Type
Purchase Details
Closed on
Sep 24, 2025
Sold by
Mauth Joshua Wayne
Bought by
Garman Jennifer Lynn and Mauth Jennifer Lynn
Current Estimated Value
Purchase Details
Closed on
Jun 28, 2010
Sold by
The Secretary Of Housing & Urban Develop
Bought by
Mauth Jennifer Lynn and Mauth Joshua Wayne
Purchase Details
Closed on
May 10, 2010
Sold by
Homestreet Bank
Bought by
Secretary Of Housing & Urban Development
Purchase Details
Closed on
Feb 12, 2010
Sold by
Belshaw David R and Belshaw Marybridgette
Bought by
Homestreet Bank
Purchase Details
Closed on
Aug 6, 2007
Sold by
Robles Terri and Robles Sean
Bought by
Belshaw David R and Belshaw Marybridgette
Home Financials for this Owner
Home Financials are based on the most recent Mortgage that was taken out on this home.
Original Mortgage
$133,898
Interest Rate
6.65%
Mortgage Type
FHA
Purchase Details
Closed on
Jan 17, 2007
Sold by
Bowman Catherine A
Bought by
Robles Terri
Create a Home Valuation Report for This Property
The Home Valuation Report is an in-depth analysis detailing your home's value as well as a comparison with similar homes in the area
Home Values in the Area
Average Home Value in this Area
Purchase History
| Date | Buyer | Sale Price | Title Company |
|---|---|---|---|
| Garman Jennifer Lynn | -- | None Listed On Document | |
| Mauth Jennifer Lynn | -- | Coast Title | |
| Secretary Of Housing & Urban Development | -- | Coast Title | |
| Homestreet Bank | $145,078 | Coast Title | |
| Belshaw David R | $136,000 | Coast Title | |
| Robles Terri | $55,000 | None Available |
Source: Public Records
Mortgage History
| Date | Status | Borrower | Loan Amount |
|---|---|---|---|
| Previous Owner | Belshaw David R | $133,898 |
Source: Public Records
Tax History Compared to Growth
Tax History
| Year | Tax Paid | Tax Assessment Tax Assessment Total Assessment is a certain percentage of the fair market value that is determined by local assessors to be the total taxable value of land and additions on the property. | Land | Improvement |
|---|---|---|---|---|
| 2025 | $2,316 | $245,831 | $22,302 | $223,529 |
| 2023 | $2,529 | $211,856 | $22,302 | $189,554 |
| 2022 | $2,233 | $175,673 | $12,390 | $163,283 |
| 2021 | $1,935 | $175,673 | $12,390 | $163,283 |
| 2020 | $1,693 | $143,016 | $12,390 | $130,626 |
| 2019 | $1,374 | $121,245 | $12,390 | $108,855 |
| 2018 | $1,350 | $103,103 | $12,390 | $90,713 |
| 2017 | $1,287 | $84,960 | $12,390 | $72,570 |
| 2016 | $1,279 | $84,960 | $12,390 | $72,570 |
| 2014 | -- | $84,995 | $12,390 | $72,605 |
| 2013 | -- | $84,745 | $12,390 | $72,355 |
Source: Public Records
Map
Nearby Homes
- 2420 Simpson Ave
- 2307 Aberdeen Ave
- 2420 Aberdeen Ave
- 2218 Sumner Ave
- 2515 Sumner Ave
- 215 Ontario St
- 2214 Pacific Ave
- 110 Ontario St
- 2621 Sumner Ave
- 0 Beacon Hill Dr Unit NWM2404909
- 2640 Queets Ave
- 0 Summerhaven Development Unit NWM2344482
- 2712 Cherry St
- 2643 Queets Ave
- 2719 Pacific Ave
- 115 Beacon Hill Dr
- 2732 Aberdeen Ave
- 2735 Bay Ave
- 519 28th St
- 316 Beacon Hill Dr
- 411 24th St
- 2407 Aberdeen Ave
- 2411 Aberdeen Ave
- 2415 Aberdeen Ave
- 2404 Aberdeen Ave
- 505 24th St
- 2408 Aberdeen Ave
- 2323 Aberdeen Ave
- 2410 Simpson Ave
- 2419 Aberdeen Ave
- 2324 Simpson Ave
- 2324 Aberdeen Ave
- 2416 Aberdeen Ave
- 2416 Simpson Ave
- 2318 Aberdeen Ave
- 2318 Simpson Ave
- 2311 Aberdeen Ave
- 2310 Simpson Ave
- 512 24th St
- 2401 Pacific Ave