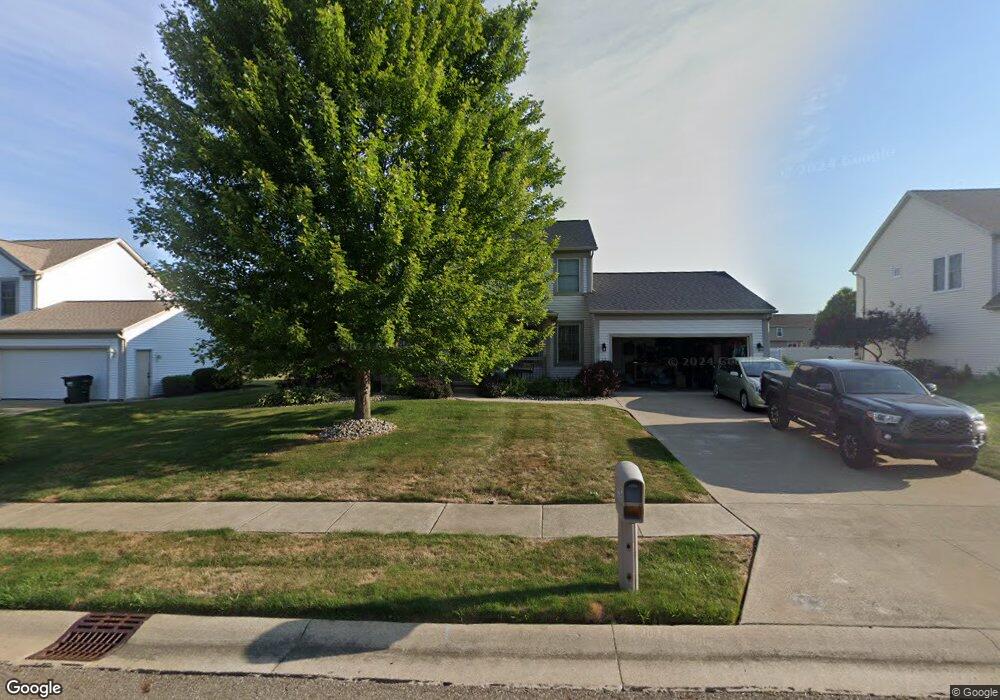
2405 Bowers St NW Uniontown, OH 44685
Estimated Value: $364,501 - $424,000
4
Beds
3
Baths
2,104
Sq Ft
$188/Sq Ft
Est. Value
About This Home
This home is located at 2405 Bowers St NW, Uniontown, OH 44685 and is currently estimated at $395,875, approximately $188 per square foot. 2405 Bowers St NW is a home located in Stark County with nearby schools including Lake Middle/High School, Lake Center Christian School, and Mayfair Christian School.
Ownership History
Date
Name
Owned For
Owner Type
Purchase Details
Closed on
Aug 24, 2007
Sold by
Oleary Shawn P and Oleary Cristina M
Bought by
Johnson Brian R and Johnson Holly R
Current Estimated Value
Home Financials for this Owner
Home Financials are based on the most recent Mortgage that was taken out on this home.
Original Mortgage
$217,000
Interest Rate
6.77%
Mortgage Type
Purchase Money Mortgage
Purchase Details
Closed on
Oct 4, 2005
Sold by
Elson J Hershberger Construction Inc
Bought by
Oleary Shawn P and Oleary Cristina M
Home Financials for this Owner
Home Financials are based on the most recent Mortgage that was taken out on this home.
Original Mortgage
$163,120
Interest Rate
5.88%
Mortgage Type
Fannie Mae Freddie Mac
Purchase Details
Closed on
Jul 28, 2004
Sold by
21St Homes Inc
Bought by
Elson J Hershberger Constructions Inc and Efficient Homes
Create a Home Valuation Report for This Property
The Home Valuation Report is an in-depth analysis detailing your home's value as well as a comparison with similar homes in the area
Home Values in the Area
Average Home Value in this Area
Purchase History
| Date | Buyer | Sale Price | Title Company |
|---|---|---|---|
| Johnson Brian R | $217,000 | Attorney | |
| Oleary Shawn P | $203,900 | First American Title Ins Co | |
| Elson J Hershberger Constructions Inc | $41,500 | -- |
Source: Public Records
Mortgage History
| Date | Status | Borrower | Loan Amount |
|---|---|---|---|
| Previous Owner | Johnson Brian R | $217,000 | |
| Previous Owner | Oleary Shawn P | $163,120 |
Source: Public Records
Tax History Compared to Growth
Tax History
| Year | Tax Paid | Tax Assessment Tax Assessment Total Assessment is a certain percentage of the fair market value that is determined by local assessors to be the total taxable value of land and additions on the property. | Land | Improvement |
|---|---|---|---|---|
| 2025 | -- | $110,080 | $27,370 | $82,710 |
| 2024 | -- | $110,080 | $27,370 | $82,710 |
| 2023 | $4,487 | $87,540 | $24,400 | $63,140 |
| 2022 | $2,251 | $87,540 | $24,400 | $63,140 |
| 2021 | $4,550 | $87,540 | $24,400 | $63,140 |
| 2020 | $4,389 | $75,430 | $21,040 | $54,390 |
| 2019 | $4,353 | $75,430 | $21,040 | $54,390 |
| 2018 | $4,358 | $75,430 | $21,040 | $54,390 |
| 2017 | $4,451 | $71,300 | $19,320 | $51,980 |
| 2016 | $4,459 | $71,300 | $19,320 | $51,980 |
| 2015 | $4,459 | $71,300 | $19,320 | $51,980 |
| 2014 | $1,997 | $65,660 | $17,780 | $47,880 |
| 2013 | $1,999 | $65,660 | $17,780 | $47,880 |
Source: Public Records
Map
Nearby Homes
- 2601 Lake Center St NW
- 0 Heckman St NW Unit 5170772
- 11316 Cleveland Ave NW
- 12235 Cantburg Ave NW
- 1771 Midway St NW
- 10531 Newbury Ave NW
- 3026 Wright Rd NW
- 3048 Wright Rd NW
- 2490 Ledgestone Dr NW
- 2334 Ledgestone Dr NW
- 2244 Ledgestone Dr NW
- 2316 Ledgestone Dr NW
- 2335 Ledgestone Dr NW
- 2273 Ledgestone Dr NW
- 2319 Ledgestone Dr NW
- 2255 Ledgestone Dr NW
- 12494 Bridgemont Ave NW
- 843 Brodie Ct
- 835 Brodie Ct
- 3648 Mulberry St NW
- 2421 Bowers St NW
- 2391 Bowers St NW
- 2379 Bowers St NW
- 2437 Bowers St NW
- 2406 Wilmont St NW
- 2420 Wilmont St NW
- 2394 Wilmont St NW
- 2408 Bowers St NW
- 2436 Wilmont St NW
- 2380 Wilmont St NW
- 2453 Bowers St NW
- 2392 Bowers St NW
- 2422 Bowers St NW
- 2365 Bowers St NW
- 2376 Bowers St NW
- 2438 Bowers St NW
- 2450 Wilmont St NW
- 2366 Wilmont St NW
- 2454 Bowers St NW
- 2469 Bowers St NW