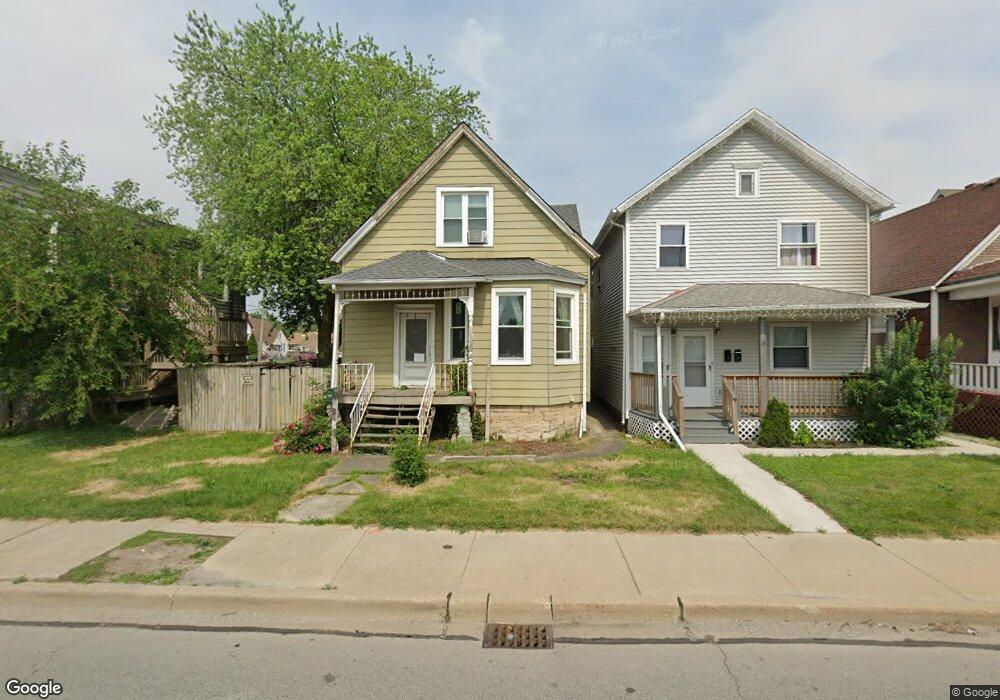
2405 Chicago Rd Chicago Heights, IL 60411
Hungry Hill NeighborhoodEstimated Value: $86,000 - $136,000
3
Beds
1
Bath
1,047
Sq Ft
$106/Sq Ft
Est. Value
About This Home
This home is located at 2405 Chicago Rd, Chicago Heights, IL 60411 and is currently estimated at $111,191, approximately $106 per square foot. 2405 Chicago Rd is a home located in Cook County with nearby schools including U S Grant Elementary School, Bloom High School, and St Agnes School.
Ownership History
Date
Name
Owned For
Owner Type
Purchase Details
Closed on
Nov 29, 2004
Sold by
Bell Sites Llc
Bought by
Cabello Patricia
Current Estimated Value
Purchase Details
Closed on
Mar 27, 2001
Sold by
Orr David D
Bought by
Bell Sites Llc
Purchase Details
Closed on
Apr 11, 1997
Sold by
Morris Richard J and Morris Valerie J
Bought by
Cabello Frank and Cabello Patricia
Home Financials for this Owner
Home Financials are based on the most recent Mortgage that was taken out on this home.
Original Mortgage
$58,050
Interest Rate
7.92%
Mortgage Type
Purchase Money Mortgage
Purchase Details
Closed on
Feb 22, 1994
Sold by
Ellison James E and Ellison Emma Louise
Bought by
Morris Richard J and Morris Valeri J
Home Financials for this Owner
Home Financials are based on the most recent Mortgage that was taken out on this home.
Original Mortgage
$34,300
Interest Rate
7.05%
Mortgage Type
Purchase Money Mortgage
Create a Home Valuation Report for This Property
The Home Valuation Report is an in-depth analysis detailing your home's value as well as a comparison with similar homes in the area
Home Values in the Area
Average Home Value in this Area
Purchase History
| Date | Buyer | Sale Price | Title Company |
|---|---|---|---|
| Cabello Patricia | -- | -- | |
| Bell Sites Llc | -- | -- | |
| Cabello Frank | $64,400 | Attorneys Natl Title Network | |
| Morris Richard J | $32,666 | -- |
Source: Public Records
Mortgage History
| Date | Status | Borrower | Loan Amount |
|---|---|---|---|
| Previous Owner | Cabello Frank | $58,050 | |
| Previous Owner | Morris Richard J | $34,300 |
Source: Public Records
Tax History Compared to Growth
Tax History
| Year | Tax Paid | Tax Assessment Tax Assessment Total Assessment is a certain percentage of the fair market value that is determined by local assessors to be the total taxable value of land and additions on the property. | Land | Improvement |
|---|---|---|---|---|
| 2024 | $541 | $4,334 | $1,172 | $3,162 |
| 2023 | $501 | $4,334 | $1,172 | $3,162 |
| 2022 | $501 | $4,214 | $1,016 | $3,198 |
| 2021 | $536 | $4,213 | $1,015 | $3,198 |
| 2020 | $653 | $4,213 | $1,015 | $3,198 |
| 2019 | $676 | $4,603 | $937 | $3,666 |
| 2018 | $639 | $4,603 | $937 | $3,666 |
| 2017 | $643 | $4,603 | $937 | $3,666 |
| 2016 | $1,245 | $4,819 | $859 | $3,960 |
| 2015 | $1,164 | $4,819 | $859 | $3,960 |
| 2014 | $1,182 | $4,819 | $859 | $3,960 |
| 2013 | $1,535 | $5,664 | $859 | $4,805 |
Source: Public Records
Map
Nearby Homes