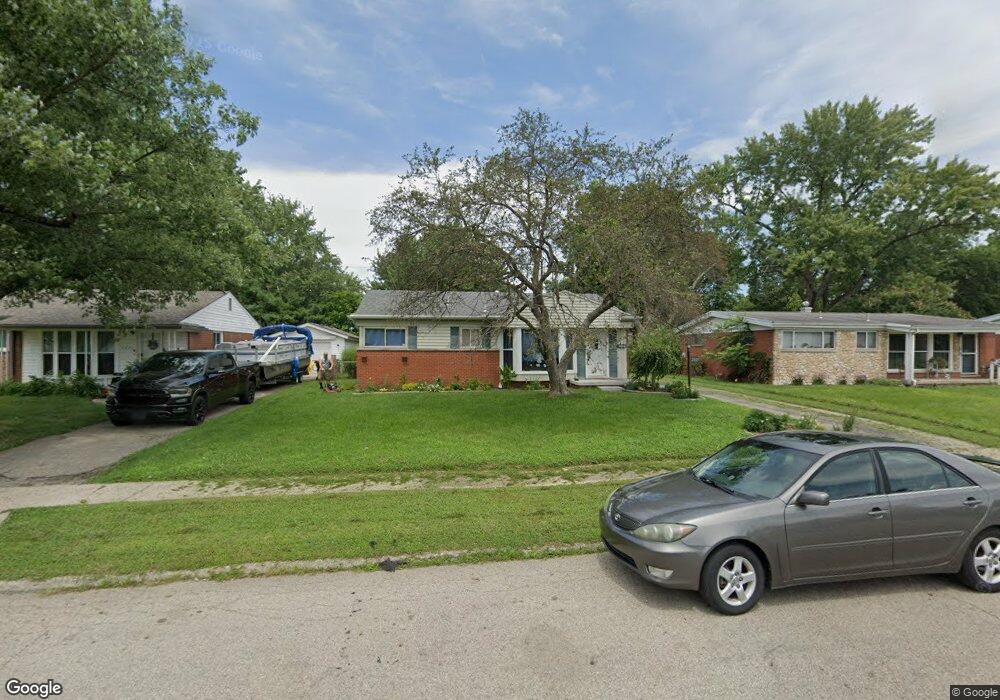
2405 Danube Ct Dayton, OH 45420
Estimated Value: $182,348 - $210,000
3
Beds
2
Baths
1,082
Sq Ft
$184/Sq Ft
Est. Value
About This Home
This home is located at 2405 Danube Ct, Dayton, OH 45420 and is currently estimated at $199,587, approximately $184 per square foot. 2405 Danube Ct is a home located in Montgomery County with nearby schools including Indian Riffle Elementary School, Kettering Middle School, and Kettering Fairmont High School.
Ownership History
Date
Name
Owned For
Owner Type
Purchase Details
Closed on
Apr 3, 2024
Sold by
Dunevant Nicholaus L
Bought by
Dunevant Revocable Trust and Dunevant
Current Estimated Value
Purchase Details
Closed on
Feb 19, 2024
Sold by
Dunevant Rachael
Bought by
Dunevant Nicholaus L
Purchase Details
Closed on
Jun 26, 2020
Sold by
Dunevant Nicholaus L
Bought by
Dunevant Nicholaus L and Dunevant Rachael
Purchase Details
Closed on
Jun 24, 2014
Sold by
Corwin Melissa Ann and Corwin Chris
Bought by
Dunevant Nicholaus L
Home Financials for this Owner
Home Financials are based on the most recent Mortgage that was taken out on this home.
Original Mortgage
$60,800
Interest Rate
2.5%
Mortgage Type
Adjustable Rate Mortgage/ARM
Purchase Details
Closed on
Feb 24, 2005
Sold by
Yahle William Alphonse and Yahle William A
Bought by
Corwin Melissa Ann and Hartman Todd Michael
Create a Home Valuation Report for This Property
The Home Valuation Report is an in-depth analysis detailing your home's value as well as a comparison with similar homes in the area
Home Values in the Area
Average Home Value in this Area
Purchase History
| Date | Buyer | Sale Price | Title Company |
|---|---|---|---|
| Dunevant Revocable Trust | -- | None Listed On Document | |
| Dunevant Nicholaus L | -- | None Listed On Document | |
| Dunevant Nicholaus L | -- | None Available | |
| Dunevant Nicholaus L | $76,000 | None Available | |
| Corwin Melissa Ann | $110,000 | None Available |
Source: Public Records
Mortgage History
| Date | Status | Borrower | Loan Amount |
|---|---|---|---|
| Previous Owner | Dunevant Nicholaus L | $60,800 |
Source: Public Records
Tax History Compared to Growth
Tax History
| Year | Tax Paid | Tax Assessment Tax Assessment Total Assessment is a certain percentage of the fair market value that is determined by local assessors to be the total taxable value of land and additions on the property. | Land | Improvement |
|---|---|---|---|---|
| 2024 | $3,130 | $50,390 | $11,040 | $39,350 |
| 2023 | $3,130 | $50,390 | $11,040 | $39,350 |
| 2022 | $3,071 | $39,090 | $8,560 | $30,530 |
| 2021 | $2,840 | $39,090 | $8,560 | $30,530 |
| 2020 | $2,849 | $39,090 | $8,560 | $30,530 |
| 2019 | $2,726 | $33,060 | $8,560 | $24,500 |
| 2018 | $2,740 | $33,060 | $8,560 | $24,500 |
| 2017 | $2,524 | $33,060 | $8,560 | $24,500 |
| 2016 | $2,346 | $28,850 | $8,560 | $20,290 |
| 2015 | $2,241 | $28,850 | $8,560 | $20,290 |
| 2014 | $2,241 | $28,850 | $8,560 | $20,290 |
| 2012 | -- | $35,300 | $8,580 | $26,720 |
Source: Public Records
Map
Nearby Homes
- 2301 Danube Ct
- 2432 Danube Ct
- 2512 Olson Dr
- 3428 Pobst Dr
- 3009 La Plata Dr
- 2509 E Dorothy Ln
- 2928 Prentice Dr
- 3525 Valleywood Dr
- 3116 Powhattan Place
- 2843 Purdue Dr
- 2954 Powhattan Place
- 2845 Nacoma Place
- 1801 Boesel Ave
- 2841 Chinook Ln
- 2808 Whitehorse Ave
- 3072 Leonora Dr
- 3736 Valleywood Dr
- 3241 Gracemore Ave
- 1716 Willamet Rd
- 2233 Cherry Oak Dr