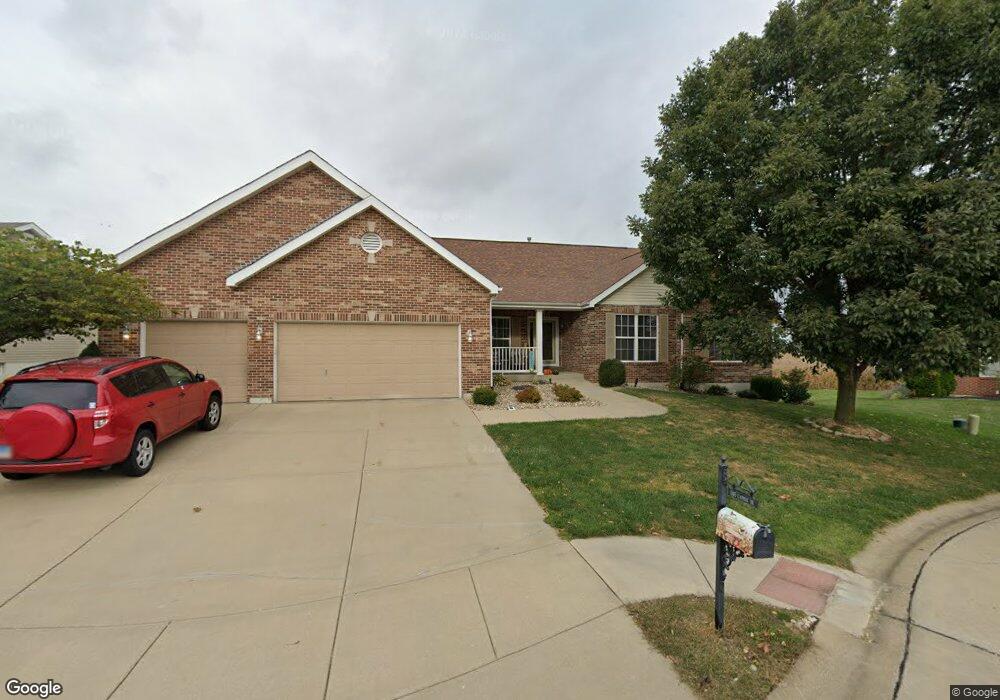
2405 Fairway Dr Belleville, IL 62220
Estimated Value: $417,000 - $450,000
3
Beds
4
Baths
2,514
Sq Ft
$170/Sq Ft
Est. Value
About This Home
This home is located at 2405 Fairway Dr, Belleville, IL 62220 and is currently estimated at $427,036, approximately $169 per square foot. 2405 Fairway Dr is a home located in St. Clair County with nearby schools including Mascoutah High School.
Ownership History
Date
Name
Owned For
Owner Type
Purchase Details
Closed on
Jun 25, 2013
Sold by
Bank Of America Na
Bought by
Lynch Thomas R and Lynch Monica
Current Estimated Value
Home Financials for this Owner
Home Financials are based on the most recent Mortgage that was taken out on this home.
Original Mortgage
$176,000
Interest Rate
3.62%
Mortgage Type
New Conventional
Purchase Details
Closed on
Mar 27, 2013
Sold by
Upperman Bruce
Bought by
Bank Of America Na and Hsbc Bank Usa Na
Purchase Details
Closed on
Nov 22, 2006
Sold by
Vantage Homes Of Illinois Llc
Bought by
Upperman Bruce and Upperman Beverly
Home Financials for this Owner
Home Financials are based on the most recent Mortgage that was taken out on this home.
Original Mortgage
$284,880
Interest Rate
7.87%
Mortgage Type
New Conventional
Purchase Details
Closed on
Mar 16, 2006
Sold by
Double Eagle Development Inc
Bought by
Vantage Homes Of Illinois Llc
Create a Home Valuation Report for This Property
The Home Valuation Report is an in-depth analysis detailing your home's value as well as a comparison with similar homes in the area
Home Values in the Area
Average Home Value in this Area
Purchase History
| Date | Buyer | Sale Price | Title Company |
|---|---|---|---|
| Lynch Thomas R | $220,000 | None Available | |
| Bank Of America Na | -- | None Available | |
| Upperman Bruce | $300,000 | Benchmark Title Company | |
| Vantage Homes Of Illinois Llc | $645,000 | Benchmark Title Company |
Source: Public Records
Mortgage History
| Date | Status | Borrower | Loan Amount |
|---|---|---|---|
| Closed | Lynch Thomas R | $176,000 | |
| Previous Owner | Upperman Bruce | $284,880 |
Source: Public Records
Tax History Compared to Growth
Tax History
| Year | Tax Paid | Tax Assessment Tax Assessment Total Assessment is a certain percentage of the fair market value that is determined by local assessors to be the total taxable value of land and additions on the property. | Land | Improvement |
|---|---|---|---|---|
| 2024 | $8,017 | $113,186 | $20,047 | $93,139 |
| 2023 | $8,166 | $109,652 | $19,649 | $90,003 |
| 2022 | $7,648 | $98,714 | $17,689 | $81,025 |
| 2021 | $7,233 | $91,258 | $16,353 | $74,905 |
| 2020 | $6,963 | $86,299 | $15,465 | $70,834 |
| 2019 | $6,628 | $82,121 | $15,490 | $66,631 |
| 2018 | $6,437 | $80,345 | $15,155 | $65,190 |
| 2017 | $6,752 | $79,781 | $15,049 | $64,732 |
| 2016 | $6,865 | $82,750 | $14,729 | $68,021 |
| 2014 | $6,363 | $79,631 | $15,287 | $64,344 |
| 2013 | $5,865 | $80,770 | $15,506 | $65,264 |
Source: Public Records
Map
Nearby Homes
- 2832 Fairway Dr
- 2793 Brookmeadow Dr
- 1609 10th Fairway Dr
- 262 Eastbrook Dr
- 255 Brookmont Dr
- 240 Brookmont Dr
- 2701 Brookmeadow Dr
- 2917 18th Fairway Dr
- 1566 Orchard Lakes Cir
- 2655 Brookmeadow Dr
- 1514 Orchard Lakes Cir
- 1338 Orchard Lakes Cir
- Sunrise Plan at Orchard Lakes
- Bristol Villa Plan at Orchard Lakes
- Hannah Plan at Orchard Lakes
- Winchester A Plan at Orchard Lakes
- Herndon Plan at Orchard Lakes
- Scarlett Plan at Orchard Lakes
- Culpepper Plan at Orchard Lakes
- Covington Plan at Orchard Lakes
- 2409 Fairway Dr
- 2401 Fairway Dr
- 2410 Fairway Dr
- 2413 Fairway Dr
- 2406 Fairway Dr
- 2414 Fairway Dr
- 2402 Fairway Dr
- 2417 Fairway Dr
- 2418 Fairway Dr
- 2205 Jack Nicklaus Dr
- 2201 Jack Nicklaus Dr
- 2209 Jack Nicklaus Dr
- 2421 Fairway Dr
- 2422 Fairway Dr
- 2425 Fairway Dr
- 2205 Arnold Palmer Dr
- 2213 Jack Nicklaus Dr
- 2200 Jack Nicklaus Dr
- 2209 Arnold Palmer Dr
- 2212 Jack Nicklaus Dr