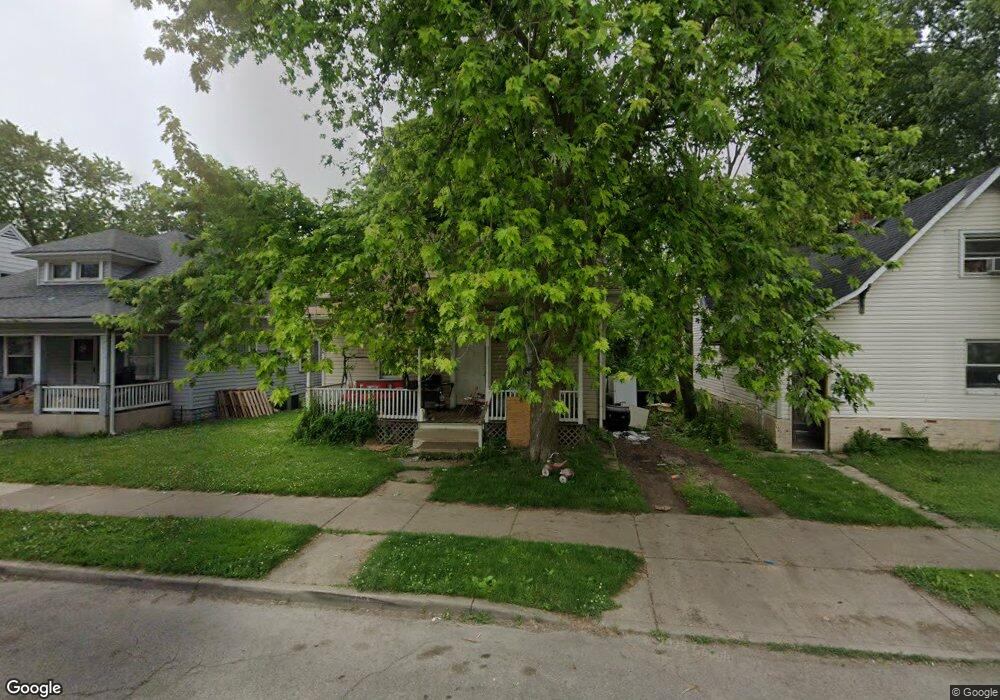
2405 Fletcher St Anderson, IN 46016
Estimated Value: $99,000 - $160,000
3
Beds
1
Bath
2,330
Sq Ft
$49/Sq Ft
Est. Value
About This Home
This home is located at 2405 Fletcher St, Anderson, IN 46016 and is currently estimated at $115,130, approximately $49 per square foot. 2405 Fletcher St is a home located in Madison County with nearby schools including Valley Grove Elementary School, Highland Middle School, and Anderson High School.
Ownership History
Date
Name
Owned For
Owner Type
Purchase Details
Closed on
Jul 19, 2018
Sold by
4 Bridge Llc
Bought by
2405 Fletcher St Trust
Current Estimated Value
Purchase Details
Closed on
Apr 14, 2014
Sold by
Madison County Auditor
Bought by
Bridge Llc
Purchase Details
Closed on
Feb 6, 2013
Sold by
Kedry Yariv
Bought by
Shlomof Averm
Purchase Details
Closed on
May 9, 2012
Sold by
Shlomof Averm
Bought by
Kedry Yariv
Purchase Details
Closed on
Nov 10, 2010
Sold by
Varsha Rami
Bought by
Avraham Beit
Purchase Details
Closed on
Aug 10, 2009
Sold by
Mohawk United Llc
Bought by
Varsha Rami
Purchase Details
Closed on
Oct 30, 2008
Sold by
Visio Capital Llc
Bought by
Mohawk United Llc
Purchase Details
Closed on
Dec 31, 2007
Sold by
Econohomes Llc
Bought by
Visio Capital Llc
Purchase Details
Closed on
Jul 22, 2005
Sold by
Manning Timothy and Manning Timothy A
Bought by
Wachovia Bank Na
Create a Home Valuation Report for This Property
The Home Valuation Report is an in-depth analysis detailing your home's value as well as a comparison with similar homes in the area
Home Values in the Area
Average Home Value in this Area
Purchase History
| Date | Buyer | Sale Price | Title Company |
|---|---|---|---|
| 2405 Fletcher St Trust | -- | None Available | |
| Bridge Llc | $1,503 | -- | |
| Shlomof Averm | -- | None Available | |
| Kedry Yariv | -- | None Available | |
| Avraham Beit | -- | None Available | |
| Varsha Rami | -- | -- | |
| Mohawk United Llc | $4,800 | -- | |
| Visio Capital Llc | -- | -- | |
| Wachovia Bank Na | $61,148 | -- |
Source: Public Records
Tax History Compared to Growth
Tax History
| Year | Tax Paid | Tax Assessment Tax Assessment Total Assessment is a certain percentage of the fair market value that is determined by local assessors to be the total taxable value of land and additions on the property. | Land | Improvement |
|---|---|---|---|---|
| 2024 | $1,109 | $49,900 | $6,400 | $43,500 |
| 2023 | $1,020 | $45,600 | $6,000 | $39,600 |
| 2022 | $1,022 | $45,700 | $5,700 | $40,000 |
| 2021 | $947 | $42,100 | $5,700 | $36,400 |
| 2020 | $901 | $39,900 | $5,400 | $34,500 |
| 2019 | $880 | $38,900 | $5,400 | $33,500 |
| 2018 | $826 | $35,800 | $5,400 | $30,400 |
| 2017 | $706 | $35,300 | $5,400 | $29,900 |
| 2016 | $706 | $35,300 | $5,400 | $29,900 |
| 2014 | $846 | $42,300 | $5,600 | $36,700 |
| 2013 | $846 | $42,300 | $5,600 | $36,700 |
Source: Public Records
Map
Nearby Homes
- 2410 Central Ave
- 2420 Fletcher St
- 2328 Fletcher St
- 2310 Main St
- 2122 Fletcher St
- 0 Pearl St
- 2111 Central Ave
- 2126 Pearl St
- 2122 Pearl St
- 2639 Central Ave
- 2519 Jackson St
- 2007 Fletcher St
- 2806 Meridian St
- 1820 Central Ave
- 2915 Central Ave
- 1827 Walnut St
- 2016 Jefferson St
- 1902 Main St
- 2220 Lincoln St
- 2530 Lincoln St
- 2407 Fletcher St
- 2403 Fletcher St
- 2415 Fletcher St
- 2401 Fletcher St
- 2329 Fletcher St
- 2406 Central Ave
- 2414 Central Ave
- 2423 Fletcher St
- 2416 Central Ave
- 2400 Central Ave
- 2325 Fletcher St
- 2406 Fletcher St
- 2323 Fletcher St
- 2414 Fletcher St
- 2404 Fletcher St
- 2418 1/2 Central Ave
- 2326 Central Ave
- 2418 Fletcher St
- 2416 Fletcher St
- 2400 Fletcher St