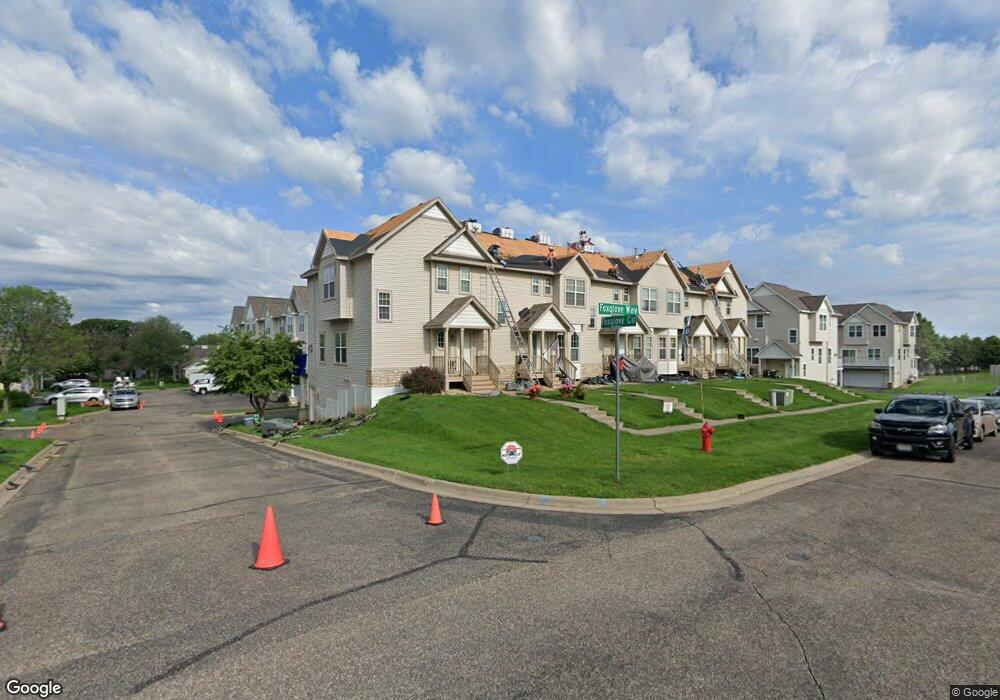
2405 Foxglove Cir Unit 9 Hudson, WI 54016
Estimated Value: $291,000 - $316,000
3
Beds
3
Baths
1,804
Sq Ft
$166/Sq Ft
Est. Value
About This Home
This home is located at 2405 Foxglove Cir Unit 9, Hudson, WI 54016 and is currently estimated at $300,333, approximately $166 per square foot. 2405 Foxglove Cir Unit 9 is a home located in St. Croix County with nearby schools including River Crest Elementary School, Hudson Middle School, and Hudson High School.
Ownership History
Date
Name
Owned For
Owner Type
Purchase Details
Closed on
Feb 25, 2022
Sold by
Roman and Jennifer
Bought by
Paul L Anderson Properties Llc
Current Estimated Value
Purchase Details
Closed on
Feb 7, 2020
Sold by
Haslup Laura
Bought by
Roman Josafat and Roman Jennifer
Home Financials for this Owner
Home Financials are based on the most recent Mortgage that was taken out on this home.
Original Mortgage
$208,550
Interest Rate
3.6%
Mortgage Type
New Conventional
Purchase Details
Closed on
May 31, 2016
Sold by
Eral John M
Bought by
Haslup Laura
Home Financials for this Owner
Home Financials are based on the most recent Mortgage that was taken out on this home.
Original Mortgage
$178,406
Interest Rate
3.59%
Mortgage Type
New Conventional
Purchase Details
Closed on
Jan 8, 2008
Sold by
St Croix Development Group Llc
Bought by
Construction Mortgage Investors Co
Create a Home Valuation Report for This Property
The Home Valuation Report is an in-depth analysis detailing your home's value as well as a comparison with similar homes in the area
Home Values in the Area
Average Home Value in this Area
Purchase History
| Date | Buyer | Sale Price | Title Company |
|---|---|---|---|
| Paul L Anderson Properties Llc | -- | Land Title | |
| Roman Josafat | $215,000 | Titlesmart | |
| Haslup Laura | $173,500 | Land Title Inc | |
| Construction Mortgage Investors Co | $143,560 | None Available |
Source: Public Records
Mortgage History
| Date | Status | Borrower | Loan Amount |
|---|---|---|---|
| Previous Owner | Roman Josafat | $208,550 | |
| Previous Owner | Haslup Laura | $178,406 |
Source: Public Records
Tax History Compared to Growth
Tax History
| Year | Tax Paid | Tax Assessment Tax Assessment Total Assessment is a certain percentage of the fair market value that is determined by local assessors to be the total taxable value of land and additions on the property. | Land | Improvement |
|---|---|---|---|---|
| 2024 | $41 | $218,700 | $33,500 | $185,200 |
| 2023 | $3,704 | $218,700 | $33,500 | $185,200 |
| 2022 | $3,212 | $218,700 | $33,500 | $185,200 |
| 2021 | $3,309 | $218,700 | $33,500 | $185,200 |
| 2020 | $3,230 | $218,700 | $33,500 | $185,200 |
| 2019 | $3,055 | $165,200 | $30,000 | $135,200 |
| 2018 | $3,052 | $165,200 | $30,000 | $135,200 |
| 2017 | $3,029 | $165,200 | $30,000 | $135,200 |
| 2016 | $3,029 | $165,200 | $30,000 | $135,200 |
| 2015 | $2,816 | $165,200 | $30,000 | $135,200 |
| 2014 | $2,769 | $165,200 | $30,000 | $135,200 |
| 2013 | $2,873 | $165,200 | $30,000 | $135,200 |
Source: Public Records
Map
Nearby Homes
- 1620 Namekagon St Unit 3
- 2208 Cattail Way
- 2300 Rosemary Curve Curve
- 1324 Carriage Dr Unit B
- 2110 Amanda Way
- 2471 Sydney Ln
- 2363 Sydney Ln
- 2348 Sydney Ln
- 2356 Sydney Ln
- 2467 Sydney Ln
- 2359 Sydney Ln
- 2475 Sydney Ln
- 2236 Aftonn Cir
- 1720 Southpoint Ln
- 2477 Sharon Ln
- 2461 Sharon Ln
- 2233 Sharon Ln
- 2469 Sharon Ln
- 2341 Sharon Ln
- 2225 Sharon Ln
- 2409 Foxglove Cir
- 2407 Foxglove Cir Unit D10
- 2403 Foxglove Cir
- 2401 Foxglove Cir
- 2405 2405 Foxglove Cir
- 2405 2405 Foxglove-Circle-
- 2446 Foxglove Cir Unit 1222
- 2411 Foxglove Cir Unit 1222
- 2413 Foxglove Cir Unit 1222
- 2415 Foxglove Cir Unit 1222
- 2417 Foxglove Cir Unit 1222
- 2419 Foxglove Cir Unit 1222
- 2411 Foxglove Cir Unit 38
- 2417 Foxglove Cir Unit 35
- 2415 Foxglove Cir Unit 36
- 2413 Foxglove Cir Unit 37
- 2442 Foxglove Cir Unit 14
- 2439 Foxglove Cir Unit 19
- 2420 Foxglove Cir
- 2422 Foxglove Cir