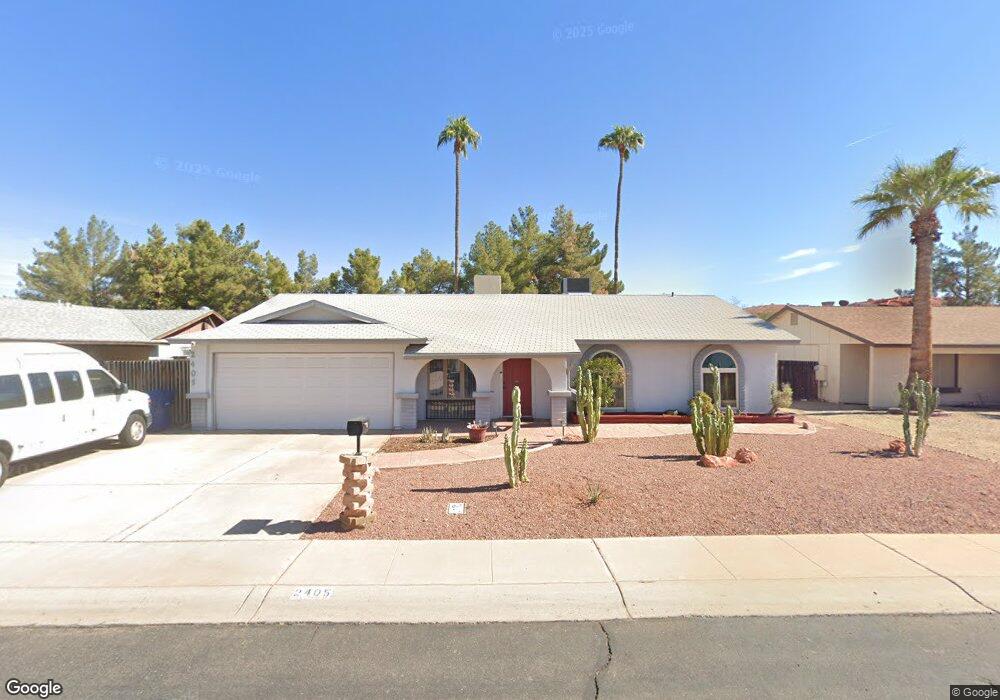
2405 N Nebraska St Unit 2 Chandler, AZ 85225
Amberwood NeighborhoodEstimated Value: $377,369 - $446,000
3
Beds
2
Baths
1,441
Sq Ft
$293/Sq Ft
Est. Value
About This Home
This home is located at 2405 N Nebraska St Unit 2, Chandler, AZ 85225 and is currently estimated at $422,342, approximately $293 per square foot. 2405 N Nebraska St Unit 2 is a home located in Maricopa County with nearby schools including Sirrine Elementary School, Franklin at Brimhall Elementary School, and Summit Academy Elementary.
Ownership History
Date
Name
Owned For
Owner Type
Purchase Details
Closed on
Jun 13, 2011
Sold by
Level Properties Ltd
Bought by
Kaiser Gwendolyn K
Current Estimated Value
Home Financials for this Owner
Home Financials are based on the most recent Mortgage that was taken out on this home.
Original Mortgage
$126,704
Outstanding Balance
$86,812
Interest Rate
4.5%
Mortgage Type
FHA
Estimated Equity
$335,530
Purchase Details
Closed on
Mar 3, 2011
Sold by
Maynard Myron C and Maynard Margaret
Bought by
Level Properties Ltd
Purchase Details
Closed on
Jul 16, 1999
Sold by
Navas Devra Faie
Bought by
Maynard Myron C and Maynard Margaret
Home Financials for this Owner
Home Financials are based on the most recent Mortgage that was taken out on this home.
Original Mortgage
$114,775
Interest Rate
7.51%
Mortgage Type
FHA
Create a Home Valuation Report for This Property
The Home Valuation Report is an in-depth analysis detailing your home's value as well as a comparison with similar homes in the area
Home Values in the Area
Average Home Value in this Area
Purchase History
| Date | Buyer | Sale Price | Title Company |
|---|---|---|---|
| Kaiser Gwendolyn K | $130,000 | Pioneer Title Agency Inc | |
| Level Properties Ltd | $77,500 | Pioneer Title Agency Inc | |
| Maynard Myron C | $115,000 | Old Republic Title Agency |
Source: Public Records
Mortgage History
| Date | Status | Borrower | Loan Amount |
|---|---|---|---|
| Open | Kaiser Gwendolyn K | $126,704 | |
| Previous Owner | Maynard Myron C | $114,775 |
Source: Public Records
Tax History Compared to Growth
Tax History
| Year | Tax Paid | Tax Assessment Tax Assessment Total Assessment is a certain percentage of the fair market value that is determined by local assessors to be the total taxable value of land and additions on the property. | Land | Improvement |
|---|---|---|---|---|
| 2025 | $1,356 | $15,898 | -- | -- |
| 2024 | $1,368 | $15,141 | -- | -- |
| 2023 | $1,368 | $32,030 | $6,400 | $25,630 |
| 2022 | $1,331 | $23,610 | $4,720 | $18,890 |
| 2021 | $1,339 | $22,010 | $4,400 | $17,610 |
| 2020 | $1,324 | $20,160 | $4,030 | $16,130 |
| 2019 | $1,219 | $18,830 | $3,760 | $15,070 |
| 2018 | $1,184 | $17,130 | $3,420 | $13,710 |
| 2017 | $1,138 | $15,880 | $3,170 | $12,710 |
| 2016 | $1,113 | $14,960 | $2,990 | $11,970 |
| 2015 | $1,048 | $13,350 | $2,670 | $10,680 |
Source: Public Records
Map
Nearby Homes
- 307 W El Prado Rd
- 286 W Palomino Dr Unit 147
- 286 W Palomino Dr Unit 99
- 286 W Palomino Dr Unit 75
- 286 W Palomino Dr Unit 85
- 305 W Nopal Place
- 2155 N Grace Blvd Unit 214
- 2155 N Grace Blvd Unit 202
- 2155 N Grace Blvd Unit 213
- 2940 N Oregon St Unit 9
- 2066 N Arbor Ln
- 2954 N Oregon St Unit 6
- 2970 N Oregon St Unit 10
- 1970 N Hartford St Unit 84
- 1970 N Hartford St Unit 88
- 2986 N Oregon St Unit 7
- 1961 N Hartford St Unit 1055
- 1961 N Hartford St Unit 1178
- 1961 N Hartford St Unit 1092
- 2029 N Sunset Dr
- 2403 N Nebraska St
- 2407 N Nebraska St
- 2401 N Nebraska St
- 2404 N Nebraska St
- 2409 N Nebraska St
- 2402 N Nebraska St
- 2406 N Nebraska St
- 2400 N Nebraska St Unit 2
- 2408 N Nebraska St
- 2411 N Nebraska St
- 301 W El Prado Rd
- 286 W Palomino Dr Unit 54
- 305 W El Alba Way
- 302 W El Prado Rd
- 2410 N Nebraska St
- 303 W El Prado Rd
- 307 W El Alba Way
- 2501 N Nebraska St
- 305 W El Prado Rd Unit 2
- 303 W El Alba Way Unit 2