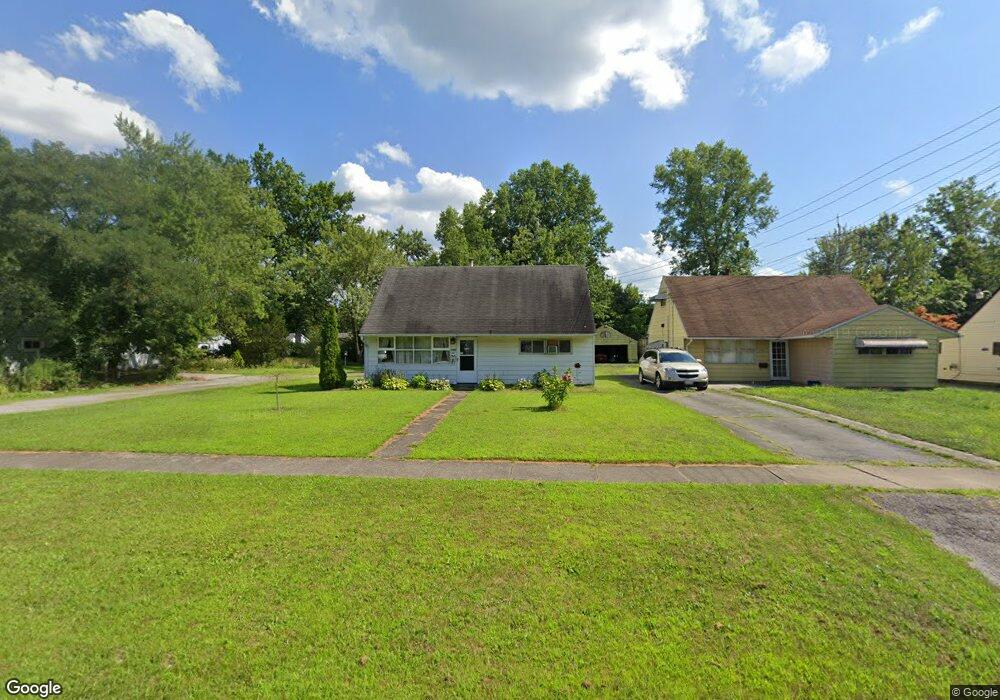
2405 Northwest Blvd NW Warren, OH 44485
Austin Village NeighborhoodEstimated Value: $64,000 - $90,000
4
Beds
1
Bath
1,248
Sq Ft
$62/Sq Ft
Est. Value
About This Home
This home is located at 2405 Northwest Blvd NW, Warren, OH 44485 and is currently estimated at $77,870, approximately $62 per square foot. 2405 Northwest Blvd NW is a home located in Trumbull County with nearby schools including McGuffey School, Warren G. Harding High School, and Steam Academy of Warren.
Ownership History
Date
Name
Owned For
Owner Type
Purchase Details
Closed on
Jul 12, 2011
Sold by
Goodman Margaret M
Bought by
Goodman James E
Current Estimated Value
Purchase Details
Closed on
Feb 3, 2006
Sold by
Wortman Lois J
Bought by
Goodman Margaret and Goodman James
Purchase Details
Closed on
May 31, 2002
Sold by
Cavalier Craig M and Cavalier Deborah A
Bought by
Wortman Lois J
Purchase Details
Closed on
Jul 18, 2001
Sold by
Martinez Mel
Bought by
Cavalier Craig M and Cavalier Deborah
Purchase Details
Closed on
Jun 9, 1995
Sold by
Puskarich Agnes A
Bought by
Lapierre Richard R and Lapierre Kimberly J
Home Financials for this Owner
Home Financials are based on the most recent Mortgage that was taken out on this home.
Original Mortgage
$36,349
Interest Rate
8.26%
Mortgage Type
FHA
Purchase Details
Closed on
Jan 6, 1995
Sold by
Est Kathleen S Rose
Bought by
Puskarich Agnes A
Purchase Details
Closed on
Jan 1, 1990
Bought by
Kathleen A Rose
Create a Home Valuation Report for This Property
The Home Valuation Report is an in-depth analysis detailing your home's value as well as a comparison with similar homes in the area
Home Values in the Area
Average Home Value in this Area
Purchase History
| Date | Buyer | Sale Price | Title Company |
|---|---|---|---|
| Goodman James E | -- | Attorney | |
| Goodman Margaret | $53,500 | None Available | |
| Wortman Lois J | $60,000 | -- | |
| Cavalier Craig M | -- | -- | |
| Lapierre Richard R | $36,000 | -- | |
| Puskarich Agnes A | $30,000 | -- | |
| Kathleen A Rose | -- | -- |
Source: Public Records
Mortgage History
| Date | Status | Borrower | Loan Amount |
|---|---|---|---|
| Previous Owner | Lapierre Richard R | $36,349 |
Source: Public Records
Tax History Compared to Growth
Tax History
| Year | Tax Paid | Tax Assessment Tax Assessment Total Assessment is a certain percentage of the fair market value that is determined by local assessors to be the total taxable value of land and additions on the property. | Land | Improvement |
|---|---|---|---|---|
| 2024 | $707 | $14,350 | $2,240 | $12,110 |
| 2023 | $707 | $14,350 | $2,240 | $12,110 |
| 2022 | $697 | $11,060 | $2,240 | $8,820 |
| 2021 | $698 | $11,060 | $2,240 | $8,820 |
| 2020 | $699 | $11,060 | $2,240 | $8,820 |
| 2019 | $708 | $10,640 | $2,240 | $8,400 |
| 2018 | $125 | $10,640 | $2,240 | $8,400 |
| 2017 | $123 | $10,640 | $2,240 | $8,400 |
| 2016 | $235 | $12,470 | $2,980 | $9,490 |
| 2015 | $233 | $12,470 | $2,980 | $9,490 |
| 2014 | $232 | $12,470 | $2,980 | $9,490 |
| 2013 | $398 | $15,480 | $2,980 | $12,500 |
Source: Public Records
Map
Nearby Homes
- 2144 Northwest Blvd NW
- 2879 Linda Dr NW
- 1727 Lexington Ave NW
- 1552 Denison Ave NW
- 1647 Southern Blvd NW
- 2931 Randolph St NW
- 1945 Norwood St NW
- 1936 Norwood St NW
- 1166 Raymond St NW
- 1325 Moncrest Dr NW
- 1056 Orlo Dr NW
- 1351 Bradford St NW
- 1331 Bradford St NW
- 666 Dickey Ave NW
- 3000 Parkman Rd NW
- 983 Garden St NW
- 806 Parkman Rd NW
- 1315 Westwood Dr NW
- 2941 Regal Dr NW
- 589 Briggs Rd
- 2415 Northwest Blvd NW
- 2425 Northwest Blvd NW
- 2335 Northwest Blvd NW
- 2435 Northwest Blvd NW
- 2334 Northwest Blvd NW
- 2325 Northwest Blvd NW
- 2436 Northwest Blvd NW
- 2406 Northwest Blvd NW
- 2445 Northwest Blvd NW
- 2324 Northwest Blvd NW
- 2416 Northwest Blvd NW
- 2426 Northwest Blvd NW
- 2317 Northwest Blvd NW
- 2455 Northwest Blvd NW
- 2356 Stewart Dr NW
- 2368 Stewart Dr NW
- 2346 Stewart Dr NW
- 2456 Northwest Blvd NW
- 2307 Northwest Blvd NW
- 2446 Northwest Blvd NW