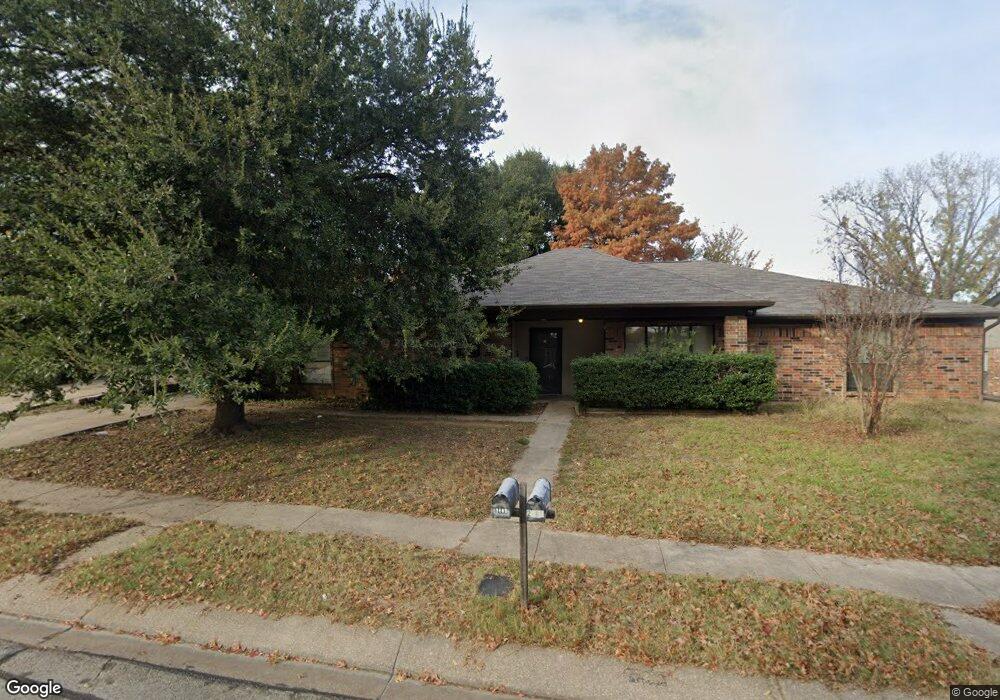
2405 Oakmont Dr Bedford, TX 76022
Estimated Value: $273,513 - $293,000
3
Beds
2
Baths
1,275
Sq Ft
$223/Sq Ft
Est. Value
About This Home
This home is located at 2405 Oakmont Dr, Bedford, TX 76022 and is currently estimated at $284,878, approximately $223 per square foot. 2405 Oakmont Dr is a home located in Tarrant County with nearby schools including Bell Manor Elementary School, Central J High School, and Trinity High School.
Ownership History
Date
Name
Owned For
Owner Type
Purchase Details
Closed on
Apr 13, 2015
Sold by
Bortz Brooke and Bortz Walter
Bought by
Baniya Soyuz and Baniya Jaya
Current Estimated Value
Home Financials for this Owner
Home Financials are based on the most recent Mortgage that was taken out on this home.
Original Mortgage
$109,584
Outstanding Balance
$86,335
Interest Rate
4.4%
Mortgage Type
FHA
Estimated Equity
$198,543
Purchase Details
Closed on
Dec 4, 2006
Sold by
Blakey James and Blakey Jay
Bought by
Crawford Brooke A
Home Financials for this Owner
Home Financials are based on the most recent Mortgage that was taken out on this home.
Original Mortgage
$106,331
Interest Rate
6.31%
Mortgage Type
Purchase Money Mortgage
Purchase Details
Closed on
Sep 16, 1993
Sold by
Branscome Vicki Lynn and Brewster Vicki Lynn
Bought by
Blakey Jessica M
Create a Home Valuation Report for This Property
The Home Valuation Report is an in-depth analysis detailing your home's value as well as a comparison with similar homes in the area
Home Values in the Area
Average Home Value in this Area
Purchase History
| Date | Buyer | Sale Price | Title Company |
|---|---|---|---|
| Baniya Soyuz | -- | Stewart | |
| Crawford Brooke A | -- | Commonwealth Land | |
| Blakey Jessica M | -- | Rattikin Title Co |
Source: Public Records
Mortgage History
| Date | Status | Borrower | Loan Amount |
|---|---|---|---|
| Open | Baniya Soyuz | $109,584 | |
| Previous Owner | Crawford Brooke A | $106,331 |
Source: Public Records
Tax History Compared to Growth
Tax History
| Year | Tax Paid | Tax Assessment Tax Assessment Total Assessment is a certain percentage of the fair market value that is determined by local assessors to be the total taxable value of land and additions on the property. | Land | Improvement |
|---|---|---|---|---|
| 2025 | $5,302 | $272,321 | $25,000 | $247,321 |
| 2024 | $5,302 | $272,321 | $25,000 | $247,321 |
| 2023 | $4,948 | $257,957 | $25,000 | $232,957 |
| 2022 | $4,107 | $236,705 | $25,000 | $211,705 |
| 2021 | $4,027 | $207,570 | $25,000 | $182,570 |
| 2020 | $3,695 | $175,416 | $25,000 | $150,416 |
| 2019 | $3,432 | $158,825 | $25,000 | $133,825 |
| 2018 | $2,738 | $128,444 | $25,000 | $103,444 |
| 2017 | $3,253 | $134,471 | $25,000 | $109,471 |
| 2016 | $2,749 | $113,621 | $25,000 | $88,621 |
| 2015 | -- | $98,200 | $11,000 | $87,200 |
| 2014 | -- | $98,200 | $11,000 | $87,200 |
Source: Public Records
Map
Nearby Homes
- 2428 Chestnut Way
- 1116 Highpoint Rd
- 1049 Stableway Ln
- 2420 Dalewood Ln
- 2421 Creek Villas Dr
- 1213 Greendale Dr
- 2201 Greendale Ct
- 2504 Westpark Way Cir
- 2101 Gettysburg Place
- 828 Gregory Ave
- 2024 Charleston Dr
- 2025 Schumac Ln
- 808 Gregory Ave
- 800 Prestwick St
- 2620 Britany Cir
- 2303 Mcmullin Dr
- 2150 Eva Ln
- 952 Charleston Dr
- 804 Natchez Ave
- 933 Charleston Ct
- 2409 Oakmont Dr
- 2401 Oakmont Dr
- 2413 Oakmont Dr
- 2345 Oakmont Dr
- 2400 Chestnut Way
- 2404 Chestnut Way
- 2417 Oakmont Dr
- 2344 Chestnut Way
- 2341 Oakmont Dr
- 2408 Chestnut Way
- 2340 Chestnut Way
- 2404 Oakmont Dr
- 2400 Oakmont Dr
- 2412 Chestnut Way
- 2421 Oakmont Dr
- 2408 Oakmont Dr
- 2337 Oakmont Dr
- 2336 Oakmont Dr
- 2336 Chestnut Way
- 2412 Oakmont Dr