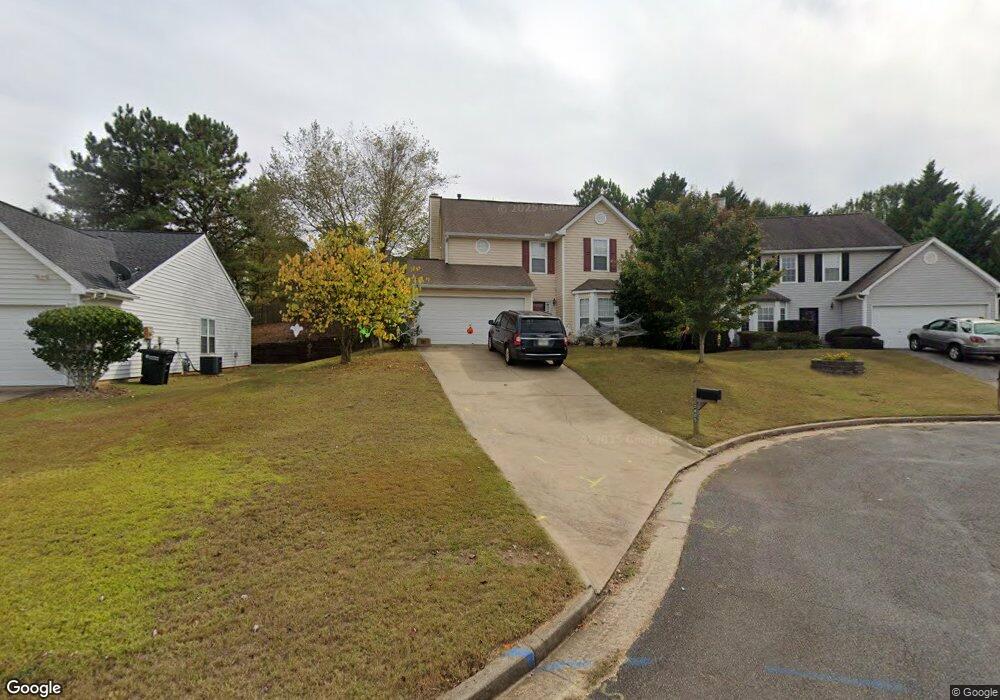
2405 Serenity Way NW Acworth, GA 30101
Estimated Value: $322,000 - $347,000
3
Beds
3
Baths
1,668
Sq Ft
$200/Sq Ft
Est. Value
About This Home
This home is located at 2405 Serenity Way NW, Acworth, GA 30101 and is currently estimated at $333,802, approximately $200 per square foot. 2405 Serenity Way NW is a home located in Cobb County with nearby schools including Baker Elementary School, Barber Middle School, and North Cobb High School.
Ownership History
Date
Name
Owned For
Owner Type
Purchase Details
Closed on
Mar 3, 2009
Sold by
Fritzges Gudreun
Bought by
Workinger Megan J
Current Estimated Value
Home Financials for this Owner
Home Financials are based on the most recent Mortgage that was taken out on this home.
Original Mortgage
$131,257
Outstanding Balance
$83,192
Interest Rate
5.15%
Mortgage Type
FHA
Estimated Equity
$250,610
Purchase Details
Closed on
Mar 8, 2004
Sold by
Last Stop Investments Llc
Bought by
Fritzges Gudrun
Home Financials for this Owner
Home Financials are based on the most recent Mortgage that was taken out on this home.
Original Mortgage
$65,000
Interest Rate
5.68%
Mortgage Type
New Conventional
Purchase Details
Closed on
Jan 6, 2004
Sold by
Collins Tamara and Collins Ivan
Bought by
Last Stop Investments Llc
Purchase Details
Closed on
Jun 16, 1997
Sold by
Summerfield Kennesaw Llc
Bought by
Collins Tamara and Collins Ivan
Create a Home Valuation Report for This Property
The Home Valuation Report is an in-depth analysis detailing your home's value as well as a comparison with similar homes in the area
Home Values in the Area
Average Home Value in this Area
Purchase History
| Date | Buyer | Sale Price | Title Company |
|---|---|---|---|
| Workinger Megan J | $139,000 | -- | |
| Fritzges Gudrun | $131,200 | -- | |
| Last Stop Investments Llc | $102,000 | -- | |
| Collins Tamara | $99,500 | -- |
Source: Public Records
Mortgage History
| Date | Status | Borrower | Loan Amount |
|---|---|---|---|
| Open | Workinger Megan J | $131,257 | |
| Previous Owner | Fritzges Gudrun | $65,000 | |
| Closed | Collins Tamara | -- |
Source: Public Records
Tax History Compared to Growth
Tax History
| Year | Tax Paid | Tax Assessment Tax Assessment Total Assessment is a certain percentage of the fair market value that is determined by local assessors to be the total taxable value of land and additions on the property. | Land | Improvement |
|---|---|---|---|---|
| 2025 | $3,220 | $138,836 | $30,000 | $108,836 |
| 2024 | $3,223 | $138,836 | $30,000 | $108,836 |
| 2023 | $2,278 | $120,320 | $17,600 | $102,720 |
| 2022 | $2,386 | $99,440 | $17,600 | $81,840 |
| 2021 | $2,019 | $82,656 | $17,600 | $65,056 |
| 2020 | $1,888 | $76,668 | $17,600 | $59,068 |
| 2019 | $1,611 | $64,012 | $17,600 | $46,412 |
| 2018 | $1,611 | $64,012 | $17,600 | $46,412 |
| 2017 | $1,442 | $59,712 | $17,600 | $42,112 |
| 2016 | $1,246 | $52,212 | $8,000 | $44,212 |
| 2015 | $1,278 | $52,212 | $8,000 | $44,212 |
| 2014 | $772 | $34,800 | $0 | $0 |
Source: Public Records
Map
Nearby Homes
- 2216 Serenity Dr NW
- 3734 Vineyards Lake Cir NW Unit U5
- 4003 Maple Ridge Ln NW
- 2266 Baker Station Dr
- 3735 Vineyards Lake Cir NW Unit 24
- 3712 Vineyards Lake Cir NW Unit U2
- 2264 Serenity Dr NW
- 4375 Lippencott Ln
- 2205 Sugar Maple Ct NW
- 2430 Brookgreen Commons NW
- 3996 Verbena Dr NW
- 4049 Paloverde Dr NW
- 4572 Rainier Way NW Unit 16
- 4494 Black Hills Dr NW Unit 13
- 3639 Abercorn Way NW
- 4321 Clairesbrook Ln
- 1135 Shiloh Ln NW
- 1418 Shiloh Way NW
- 2482 Insdale Trace NW
- 1924 Paddock Path Dr NW
- 2403 Serenity Way NW
- 2407 Serenity Way NW Unit 3
- 3707 Wavetree Pass NW
- 3707 Wavetree
- 3705 Wavetree Pass NW
- 3705 Wavetree Overlook NW
- 2401 Serenity Way NW Unit 3
- 3709 Wavetree Pass NW
- 2409 Serenity Way NW
- 3703 Wavetree Pass NW
- 3711 Wavetree Pass NW
- 2411 Serenity Way NW
- 2408 Serenity Way NW
- 2193 Serenity Dr NW
- 2193 Serenity Dr NW
- 2336 Wavetree Ln NW
- 2334 Wavetree Ln NW Unit 3
- 2413 Serenity Way NW Unit 3
- 2338 Wavetree Ln NW
- 2332 Wavetree Ln NW