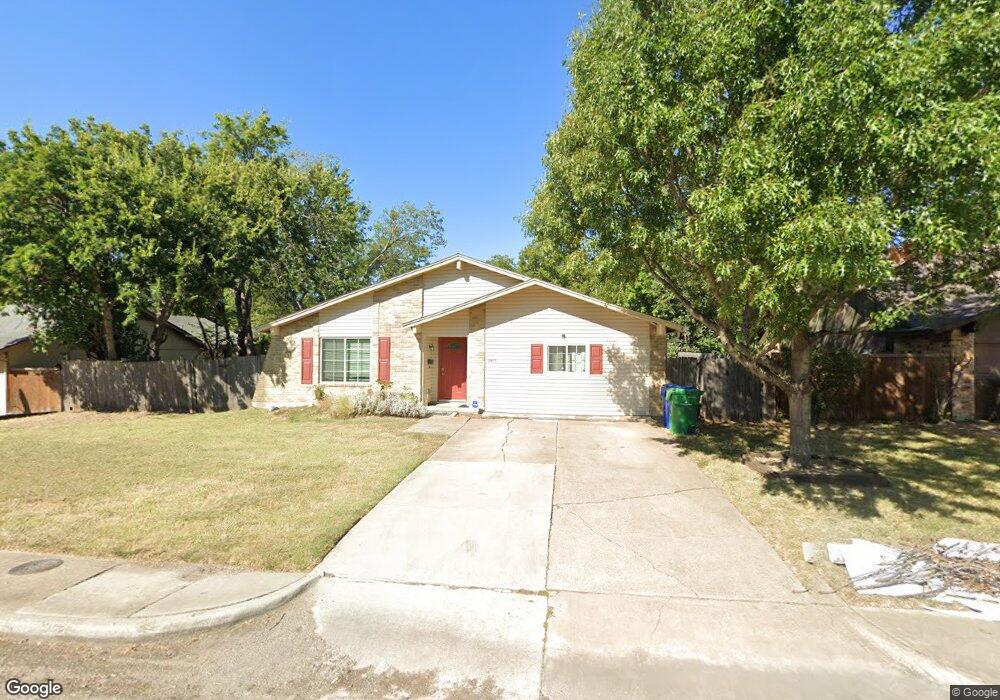
2405 Sunridge Rd Carrollton, TX 75006
Central Carrollton NeighborhoodEstimated Value: $387,954 - $450,000
4
Beds
3
Baths
2,003
Sq Ft
$207/Sq Ft
Est. Value
About This Home
This home is located at 2405 Sunridge Rd, Carrollton, TX 75006 and is currently estimated at $415,489, approximately $207 per square foot. 2405 Sunridge Rd is a home located in Dallas County with nearby schools including Blanton Elementary School, Ted Polk Middle School, and Smith High School.
Ownership History
Date
Name
Owned For
Owner Type
Purchase Details
Closed on
Dec 17, 2014
Sold by
Jacob John
Bought by
Dias Clayton P
Current Estimated Value
Home Financials for this Owner
Home Financials are based on the most recent Mortgage that was taken out on this home.
Original Mortgage
$137,464
Outstanding Balance
$103,640
Interest Rate
3.5%
Mortgage Type
FHA
Estimated Equity
$311,849
Purchase Details
Closed on
Jun 6, 2014
Sold by
U S Bank National Association
Bought by
Jacob John
Purchase Details
Closed on
Mar 5, 2014
Sold by
Flores Olga R and Flores Baltazar T
Bought by
U S Bank National Association
Purchase Details
Closed on
Aug 31, 2006
Sold by
Joo Joe K and Joo Jin H
Bought by
Flores Baltazar T and Flores Olga R
Home Financials for this Owner
Home Financials are based on the most recent Mortgage that was taken out on this home.
Original Mortgage
$101,910
Interest Rate
8.49%
Mortgage Type
Purchase Money Mortgage
Create a Home Valuation Report for This Property
The Home Valuation Report is an in-depth analysis detailing your home's value as well as a comparison with similar homes in the area
Home Values in the Area
Average Home Value in this Area
Purchase History
| Date | Buyer | Sale Price | Title Company |
|---|---|---|---|
| Dias Clayton P | -- | Allegiance | |
| Jacob John | -- | None Available | |
| U S Bank National Association | $126,202 | None Available | |
| Flores Baltazar T | -- | Ctic |
Source: Public Records
Mortgage History
| Date | Status | Borrower | Loan Amount |
|---|---|---|---|
| Open | Dias Clayton P | $137,464 | |
| Previous Owner | Flores Baltazar T | $101,910 |
Source: Public Records
Tax History Compared to Growth
Tax History
| Year | Tax Paid | Tax Assessment Tax Assessment Total Assessment is a certain percentage of the fair market value that is determined by local assessors to be the total taxable value of land and additions on the property. | Land | Improvement |
|---|---|---|---|---|
| 2025 | $4,622 | $352,830 | $60,000 | $292,830 |
| 2024 | $4,622 | $352,830 | $60,000 | $292,830 |
| 2023 | $4,622 | $337,740 | $55,000 | $282,740 |
| 2022 | $6,311 | $277,400 | $55,000 | $222,400 |
| 2021 | $5,491 | $228,760 | $50,000 | $178,760 |
| 2020 | $5,678 | $228,760 | $50,000 | $178,760 |
| 2019 | $5,828 | $222,300 | $40,000 | $182,300 |
| 2018 | $4,533 | $171,880 | $35,000 | $136,880 |
| 2017 | $4,555 | $171,880 | $35,000 | $136,880 |
| 2016 | $3,867 | $145,930 | $35,000 | $110,930 |
| 2015 | $1,840 | $139,190 | $35,000 | $104,190 |
| 2014 | $1,840 | $123,070 | $35,000 | $88,070 |
Source: Public Records
Map
Nearby Homes
- 1907 Sunridge Rd
- 2027 Embassy Way
- 2031 Embassy Way
- 2049 Embassy Way
- 2301 Greenwood Cir
- 2320 Carol Good Ln
- 2222 Salem Dr
- 2212 Salem Dr
- 2211 Salem Dr
- 2021 Brentwood Ln
- 2504 Scott Mill Rd
- 2310 Greenmeadow Dr
- 2125 Mcparland Ct
- 1805 English Ln
- 2222 Jackson Cir
- 1630 Millview Place
- 2153 Parkview
- 2003 Deerfield Dr
- 2112 Taxco Dr
- 2163 Villa Place Unit A
- 2403 Sunridge Rd
- 2407 Sunridge Rd
- 2401 Sunridge Rd
- 2409 Sunridge Rd
- 2001 Greenwood Rd
- 2309 Sunridge Rd
- 2411 Sunridge Rd
- 2400 N Josey Ln
- 2002 Wedgewood Ln
- 2003 Greenwood Rd
- 2001 Wedgewood Ln
- 2307 Sunridge Rd
- 2413 Sunridge Rd
- 2004 Wedgewood Ln
- 2000 Greenwood Rd
- 2005 Greenwood Rd
- 2003 Wedgewood Ln
- 2305 Sunridge Rd
- 2002 Greenwood Rd
- 2501 Hightrail Dr