Estimated Value: $386,000 - $418,000
3
Beds
3
Baths
2,240
Sq Ft
$182/Sq Ft
Est. Value
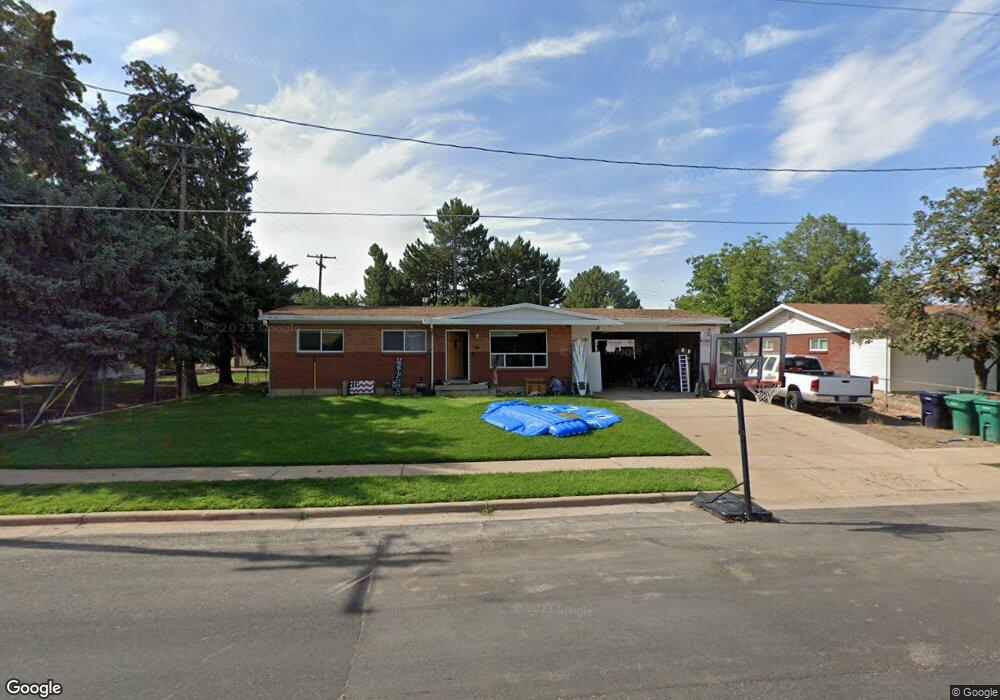
About This Home
This home is located at 2405 W 4400 S, Roy, UT 84067 and is currently estimated at $408,129, approximately $182 per square foot. 2405 W 4400 S is a home located in Weber County with nearby schools including Valley View School, Sand Ridge Junior High School, and Roy High School.
Ownership History
Date
Name
Owned For
Owner Type
Purchase Details
Closed on
Feb 25, 2021
Sold by
Bingham Erik John
Bought by
Miller Justin Carl
Current Estimated Value
Home Financials for this Owner
Home Financials are based on the most recent Mortgage that was taken out on this home.
Original Mortgage
$317,149
Outstanding Balance
$284,302
Interest Rate
2.7%
Mortgage Type
FHA
Estimated Equity
$123,827
Purchase Details
Closed on
Apr 2, 2018
Sold by
Evans John Calvin and Vera K Evans Trust
Bought by
Bingham Erik John
Home Financials for this Owner
Home Financials are based on the most recent Mortgage that was taken out on this home.
Original Mortgage
$189,994
Interest Rate
5.25%
Mortgage Type
FHA
Purchase Details
Closed on
Jun 5, 2007
Sold by
Evans Vera K and Evans John R
Bought by
Evans Vera K
Purchase Details
Closed on
Sep 20, 1993
Sold by
Evans John R and Evans Vera
Bought by
Evans John R and Evans Vera K
Create a Home Valuation Report for This Property
The Home Valuation Report is an in-depth analysis detailing your home's value as well as a comparison with similar homes in the area
Home Values in the Area
Average Home Value in this Area
Purchase History
| Date | Buyer | Sale Price | Title Company |
|---|---|---|---|
| Miller Justin Carl | -- | Security Ttl Ins Agcy Of Ut | |
| Bingham Erik John | -- | Security Ttl Of Davis Cnty I | |
| Evans Vera K | -- | None Available | |
| Evans John R | -- | -- |
Source: Public Records
Mortgage History
| Date | Status | Borrower | Loan Amount |
|---|---|---|---|
| Open | Miller Justin Carl | $317,149 | |
| Previous Owner | Bingham Erik John | $189,994 |
Source: Public Records
Tax History Compared to Growth
Tax History
| Year | Tax Paid | Tax Assessment Tax Assessment Total Assessment is a certain percentage of the fair market value that is determined by local assessors to be the total taxable value of land and additions on the property. | Land | Improvement |
|---|---|---|---|---|
| 2025 | $2,276 | $354,724 | $120,000 | $234,724 |
| 2024 | $2,223 | $191,949 | $66,000 | $125,949 |
| 2023 | $2,076 | $178,750 | $63,153 | $115,597 |
| 2022 | $2,291 | $205,700 | $55,002 | $150,698 |
| 2021 | $1,816 | $266,000 | $70,019 | $195,981 |
| 2020 | $1,723 | $232,000 | $70,019 | $161,981 |
| 2019 | $1,687 | $214,000 | $40,016 | $173,984 |
| 2018 | $1,640 | $196,000 | $36,029 | $159,971 |
| 2017 | $462 | $161,000 | $36,029 | $124,971 |
| 2016 | $427 | $82,762 | $19,021 | $63,741 |
| 2015 | $299 | $71,079 | $19,021 | $52,058 |
| 2014 | $265 | $65,884 | $16,160 | $49,724 |
Source: Public Records
Map
Nearby Homes
- 2263 W 4400 S
- 2642 W 4400 S
- 2259 W 4525 S
- 1952 W 5450 S
- 4328 S 2175 W
- 4164 S 2400 W
- 4670 S 2525 W
- 2082 W 4450 S
- 4118 Westlake Dr
- 4110 S 2275 W
- 2802 W 4375 S
- 2816 W 4400 S
- 4205 S 2075 W
- 4475 S 1975 W
- 4220 S 2075 W
- 4073 S 2175 W
- 2038 W 4600 S
- 2015 W 4225 S
- 2777 W 4175 S Unit 229
- 2778 W 4175 S Unit 235