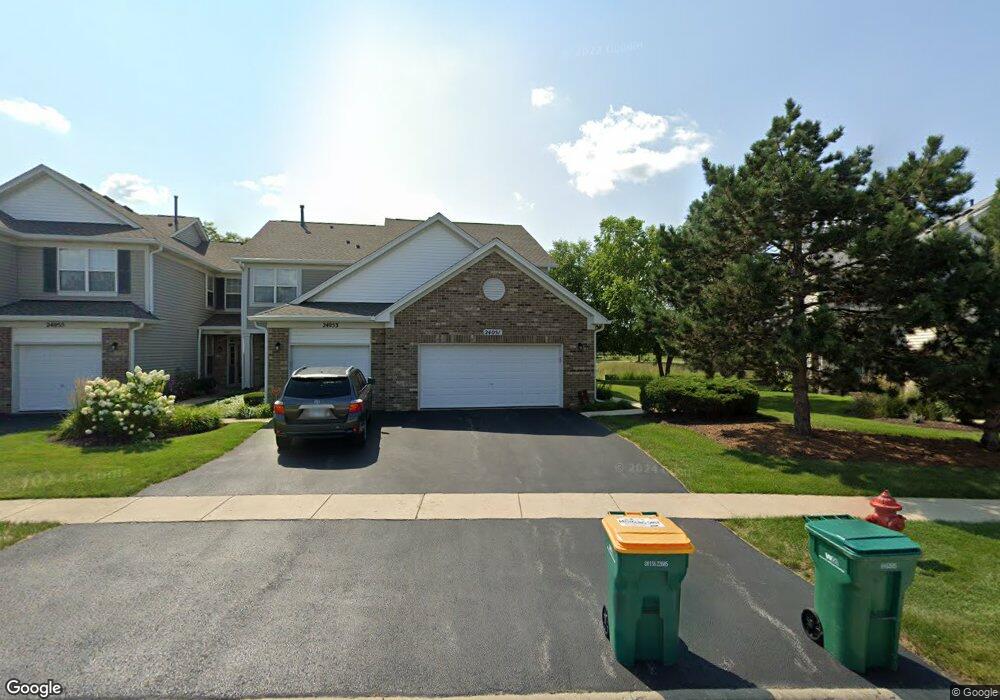
24051 Pear Tree Cir Unit 170406 Plainfield, IL 60585
North Plainfield NeighborhoodEstimated Value: $286,000 - $302,000
Studio
2
Baths
1,588
Sq Ft
$184/Sq Ft
Est. Value
About This Home
This home is located at 24051 Pear Tree Cir Unit 170406, Plainfield, IL 60585 and is currently estimated at $292,045, approximately $183 per square foot. 24051 Pear Tree Cir Unit 170406 is a home located in Will County with nearby schools including Eagle Pointe Elementary School, Heritage Grove Middle School, and Plainfield North High School.
Ownership History
Date
Name
Owned For
Owner Type
Purchase Details
Closed on
Sep 10, 2025
Sold by
Henning Robert W
Bought by
Robert W Henning Trust and Henning
Current Estimated Value
Purchase Details
Closed on
Oct 15, 2020
Sold by
Henning Robert W and Henning Heather A
Bought by
Henning Robert W
Home Financials for this Owner
Home Financials are based on the most recent Mortgage that was taken out on this home.
Original Mortgage
$121,600
Interest Rate
2.8%
Mortgage Type
New Conventional
Purchase Details
Closed on
Dec 1, 2000
Sold by
Suburban Bank & Trust Company
Bought by
Henning Robert W and Henning Heather A
Home Financials for this Owner
Home Financials are based on the most recent Mortgage that was taken out on this home.
Original Mortgage
$152,950
Interest Rate
7.69%
Mortgage Type
FHA
Create a Home Valuation Report for This Property
The Home Valuation Report is an in-depth analysis detailing your home's value as well as a comparison with similar homes in the area
Home Values in the Area
Average Home Value in this Area
Purchase History
| Date | Buyer | Sale Price | Title Company |
|---|---|---|---|
| Robert W Henning Trust | -- | None Listed On Document | |
| Henning Robert W | -- | Attorney | |
| Henning Robert W | $157,500 | Chicago Title Insurance Co |
Source: Public Records
Mortgage History
| Date | Status | Borrower | Loan Amount |
|---|---|---|---|
| Previous Owner | Henning Robert W | $121,600 | |
| Previous Owner | Henning Robert W | $152,950 | |
| Closed | Henning Robert W | $7,647 |
Source: Public Records
Tax History
| Year | Tax Paid | Tax Assessment Tax Assessment Total Assessment is a certain percentage of the fair market value that is determined by local assessors to be the total taxable value of land and additions on the property. | Land | Improvement |
|---|---|---|---|---|
| 2024 | $5,603 | $84,991 | $17,792 | $67,199 |
| 2023 | $5,603 | $75,080 | $15,717 | $59,363 |
| 2022 | $5,012 | $68,540 | $14,868 | $53,672 |
| 2021 | $4,816 | $65,276 | $14,160 | $51,116 |
| 2020 | $4,808 | $64,242 | $13,936 | $50,306 |
| 2019 | $4,729 | $62,431 | $13,543 | $48,888 |
| 2018 | $4,292 | $56,195 | $13,246 | $42,949 |
| 2017 | $4,263 | $54,744 | $12,904 | $41,840 |
| 2016 | $4,267 | $53,565 | $12,626 | $40,939 |
| 2015 | $4,555 | $51,504 | $12,140 | $39,364 |
| 2014 | $4,555 | $54,190 | $12,140 | $42,050 |
| 2013 | $4,555 | $54,190 | $12,140 | $42,050 |
Source: Public Records
Map
Nearby Homes
- 24029 Pear Tree Cir
- 24190 Pear Tree Cir Unit 171308
- 24336 Apple Tree Ln
- 12740 S Nicholas Dr
- 24339 Apple Tree Ln
- 11823 Wolf Creek Ln
- 24329 Leski Ln Unit 1
- 2711 Lawlor Ln
- 12542 Larkspur Ln
- 2739 Lawlor Ln
- 5907 Polo St
- 2547 Tailshot Rd
- 2611 Lawlor Ln
- 2539 Tailshot Rd
- 2607 Lawlor Ln
- 2516 Lawlor Ln
- 2512 Lawlor Ln
- 12455 S Compass Ave
- 12460 S Compass Ave
- 2547 Mallet Ct
- 24045 Pear Tree Cir Unit 170301
- 24059 Pear Tree Cir Unit 170402
- 24059 Pear Tree Cir Unit 2405
- 24053 Pear Tree Cir Unit 170405
- 24057 Pear Tree Cir Unit 170403
- 24061 Pear Tree Cir Unit 170401
- 24055 Pear Tree Cir Unit 170404
- 24057 Pear Tree Cir Unit 57
- 24041 W Pear Tree Cir Unit 170303
- 24039 Pear Tree Cir Unit 170304
- 24035 Pear Tree Cir Unit 170306
- 24060 Pear Tree Cir Unit 172006
- 24054 Pear Tree Cir Unit 172003
- 24056 Pear Tree Cir Unit 172004
- 24052 Pear Tree Cir Unit 172002
- 24058 Pear Tree Cir Unit 172005
- 24050 W Pear Tree Cir Unit 172001
- 24077 Pear Tree Cir Unit 170501
- 24075 Pear Tree Cir Unit 170502
- 24067 Pear Tree Cir Unit 170506
Your Personal Tour Guide
Ask me questions while you tour the home.