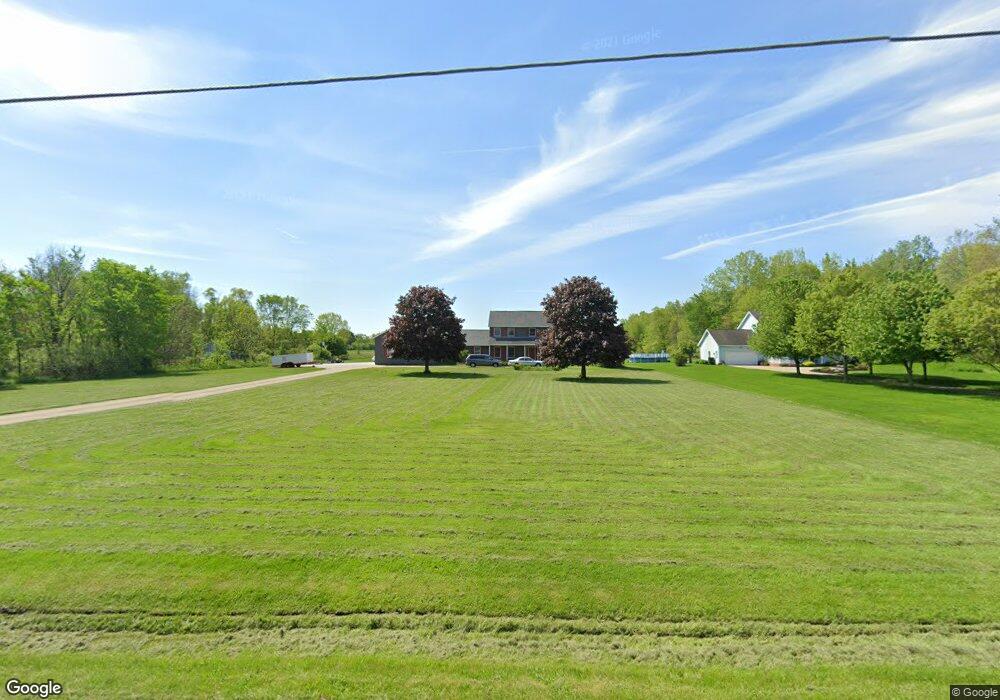
2406 Applegrove St NE Canton, OH 44721
Estimated Value: $403,000 - $501,000
4
Beds
4
Baths
3,414
Sq Ft
$133/Sq Ft
Est. Value
About This Home
This home is located at 2406 Applegrove St NE, Canton, OH 44721 and is currently estimated at $454,215, approximately $133 per square foot. 2406 Applegrove St NE is a home located in Stark County with nearby schools including Middlebranch Elementary School, Oakwood Middle School, and GlenOak High School.
Ownership History
Date
Name
Owned For
Owner Type
Purchase Details
Closed on
Sep 1, 2010
Sold by
Russo Daniel and Russo Rose M
Bought by
Russo Leo J
Current Estimated Value
Home Financials for this Owner
Home Financials are based on the most recent Mortgage that was taken out on this home.
Original Mortgage
$108,750
Outstanding Balance
$71,115
Interest Rate
4.25%
Mortgage Type
New Conventional
Estimated Equity
$383,100
Purchase Details
Closed on
Jun 6, 2000
Sold by
Russo Laurie A
Bought by
Russo Daniel and Russo Daniel P
Create a Home Valuation Report for This Property
The Home Valuation Report is an in-depth analysis detailing your home's value as well as a comparison with similar homes in the area
Home Values in the Area
Average Home Value in this Area
Purchase History
| Date | Buyer | Sale Price | Title Company |
|---|---|---|---|
| Russo Leo J | $145,000 | Attorney | |
| Russo Daniel | -- | Quality Title Agency Inc |
Source: Public Records
Mortgage History
| Date | Status | Borrower | Loan Amount |
|---|---|---|---|
| Open | Russo Leo J | $108,750 |
Source: Public Records
Tax History Compared to Growth
Tax History
| Year | Tax Paid | Tax Assessment Tax Assessment Total Assessment is a certain percentage of the fair market value that is determined by local assessors to be the total taxable value of land and additions on the property. | Land | Improvement |
|---|---|---|---|---|
| 2025 | -- | $163,560 | $33,320 | $130,240 |
| 2024 | -- | $163,560 | $33,320 | $130,240 |
| 2023 | $5,657 | $118,790 | $21,210 | $97,580 |
| 2022 | $5,680 | $118,790 | $21,210 | $97,580 |
| 2021 | $5,705 | $118,790 | $21,210 | $97,580 |
| 2020 | $5,274 | $99,790 | $18,270 | $81,520 |
| 2019 | $5,233 | $77,050 | $18,280 | $58,770 |
| 2018 | $3,997 | $77,050 | $18,280 | $58,770 |
| 2017 | $3,950 | $69,930 | $17,780 | $52,150 |
| 2016 | $3,960 | $69,930 | $17,780 | $52,150 |
| 2015 | $3,831 | $69,930 | $17,780 | $52,150 |
| 2014 | $1,614 | $64,470 | $16,380 | $48,090 |
| 2013 | $1,763 | $64,470 | $16,380 | $48,090 |
Source: Public Records
Map
Nearby Homes
- 7431 Middlebranch Ave NE
- 7192 Middlebranch Ave NE
- 6930 Firestone Rd NE
- 7023 Chatfield Ave NE
- 6807 Sun Valley Ave NE
- 6880 Birchbark Ave NE
- 7606 Knollridge Ave NE
- 7099 Fenwick Ave NE
- 3151 Knollridge Cir NE
- 6666 Carriage Lane Ave NE
- 2518 Jasper St NE
- 6731 Amsel Ave NE
- 3064 Diamond St NE
- 2623 Notre Dame St NE
- 3339 Boettler St NE
- Elder Plan at Sparwood Farms
- Aspen Plan at Sparwood Farms
- Tupelo Plan at Sparwood Farms
- Spruce Plan at Sparwood Farms
- Cedar Plan at Sparwood Farms
- 2396 Applegrove St NE
- 2415 Applegrove St NE
- 2320 Applegrove St NE
- 2469 Applegrove St NE
- 2393 Applegrove St NE
- 2570 Applegrove St NE
- 7460 Panther Ave NE
- 2335 Applegrove St NE
- 7499 Panther Ave NE
- 2554 Jaguar St NE
- 2568 Jaguar St NE
- 2600 Applegrove St NE
- TBD Applegrove St NE
- 7523 Panther Ave NE
- 7500 Panther Ave NE
- 2252 Applegrove St NE
- 2586 Jaguar St NE
- 2614 Applegrove St NE
- 2275 Applegrove St NE
- 7537 Panther Ave NE