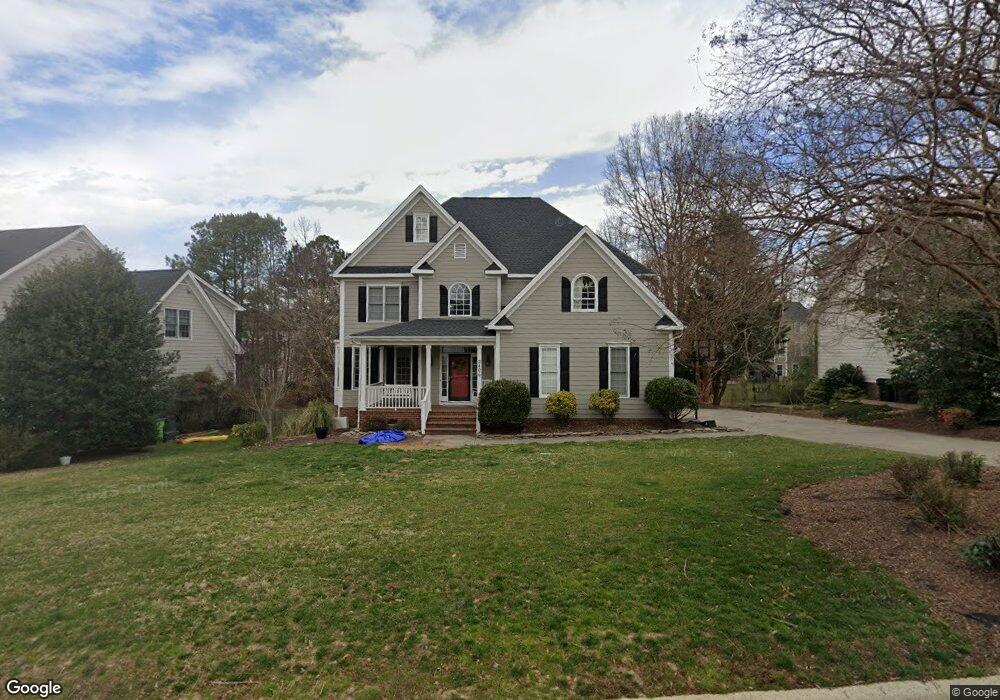
2406 Bristers Spring Way Apex, NC 27523
Beaver Creek NeighborhoodEstimated Value: $657,000 - $709,000
4
Beds
3
Baths
2,731
Sq Ft
$249/Sq Ft
Est. Value
About This Home
This home is located at 2406 Bristers Spring Way, Apex, NC 27523 and is currently estimated at $680,451, approximately $249 per square foot. 2406 Bristers Spring Way is a home located in Wake County with nearby schools including Turner Creek Elementary School, Salem Middle, and Green Level High School.
Ownership History
Date
Name
Owned For
Owner Type
Purchase Details
Closed on
Apr 17, 2008
Sold by
Casmer David T and Casmer Stephanie N
Bought by
Berglund Matthew and Berglund Jennifer
Current Estimated Value
Home Financials for this Owner
Home Financials are based on the most recent Mortgage that was taken out on this home.
Original Mortgage
$337,500
Outstanding Balance
$214,461
Interest Rate
6.03%
Mortgage Type
Purchase Money Mortgage
Estimated Equity
$465,990
Purchase Details
Closed on
Jul 8, 1999
Sold by
W T Barker Construction Company
Bought by
Casmer David T and Casmer Stephanie N
Purchase Details
Closed on
Aug 20, 1998
Sold by
Apex Properites Llc
Bought by
W T Barker Construction Company
Create a Home Valuation Report for This Property
The Home Valuation Report is an in-depth analysis detailing your home's value as well as a comparison with similar homes in the area
Home Values in the Area
Average Home Value in this Area
Purchase History
| Date | Buyer | Sale Price | Title Company |
|---|---|---|---|
| Berglund Matthew | $375,000 | None Available | |
| Casmer David T | $245,000 | -- | |
| W T Barker Construction Company | $41,000 | -- |
Source: Public Records
Mortgage History
| Date | Status | Borrower | Loan Amount |
|---|---|---|---|
| Open | Berglund Matthew | $337,500 |
Source: Public Records
Tax History Compared to Growth
Tax History
| Year | Tax Paid | Tax Assessment Tax Assessment Total Assessment is a certain percentage of the fair market value that is determined by local assessors to be the total taxable value of land and additions on the property. | Land | Improvement |
|---|---|---|---|---|
| 2025 | $5,811 | $663,225 | $220,000 | $443,225 |
| 2024 | $5,681 | $663,225 | $220,000 | $443,225 |
| 2023 | $4,339 | $393,711 | $85,000 | $308,711 |
| 2022 | $4,073 | $393,711 | $85,000 | $308,711 |
| 2021 | $3,918 | $393,711 | $85,000 | $308,711 |
| 2020 | $3,878 | $393,711 | $85,000 | $308,711 |
| 2019 | $4,132 | $362,091 | $80,000 | $282,091 |
| 2018 | $3,892 | $362,091 | $80,000 | $282,091 |
| 2017 | $3,623 | $362,091 | $80,000 | $282,091 |
| 2016 | $3,570 | $362,091 | $80,000 | $282,091 |
| 2015 | $3,551 | $351,566 | $70,000 | $281,566 |
| 2014 | $3,423 | $351,566 | $70,000 | $281,566 |
Source: Public Records
Map
Nearby Homes
- 2208 Good Shepherd Way
- 1622 Shepherds Glade Dr
- 2300 Walden Creek Dr
- 1633 Shepherds Glade Dr
- 2122 Grouse Ski Cir
- 2115 Grouse Ski Cir
- 2134 Grouse Ski Cir
- 2127 Grouse Ski Cir
- 831 Tunisian Dr
- 2060 Jersey City Place
- 7242 Morris Acres Rd
- 2201 Dial Dr
- 479 Clark Creek Ln
- 2126 Whitesmith Dr
- 2013 Keokuk Ct
- 1001 Drayman Place
- 1038 Brownsmith Dr
- 553 Duggins Point
- 2007 Ackerman Hill Dr
- 709 Oak Ridge Dr
- 2408 Bristers Spring Way
- 2404 Bristers Spring Way
- 2003 Good Sheperd Way
- 700 Mirkwood Ave
- 723 Mirkwood Ave
- 744 Mirkwood Ave
- 730 Mirkwood Ave
- 734 Mirkwood Ave
- 738 Mirkwood Ave
- 748 Mirkwood Ave
- 752 Mirkwood Ave
- 772 Mirkwood Ave
- 755 Mirkwood Ave
- 780 Mirkwood Ave
- 2007 Good Sheperd Way
- 2007 Good Shepherd Way
- 2003 Good Shepherd Way
- 2410 Bristers Spring Way
- 2400 Bristers Spring Way
- 2405 Bristers Spring Way