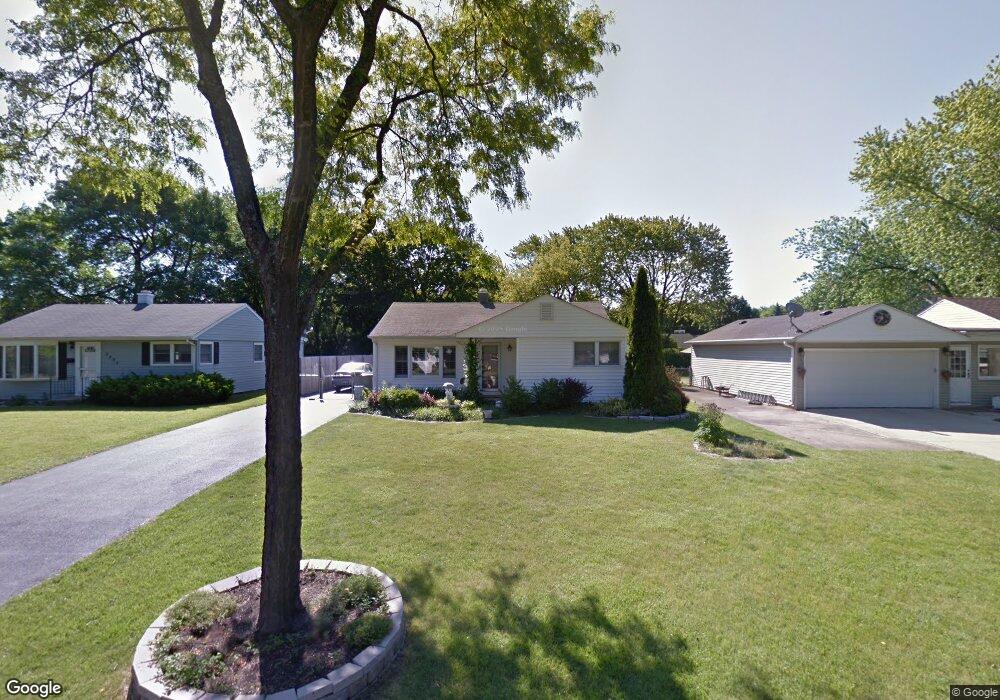
2406 Jay Ln Rolling Meadows, IL 60008
Estimated Value: $315,008 - $340,000
3
Beds
1
Bath
1,004
Sq Ft
$323/Sq Ft
Est. Value
About This Home
This home is located at 2406 Jay Ln, Rolling Meadows, IL 60008 and is currently estimated at $324,752, approximately $323 per square foot. 2406 Jay Ln is a home located in Cook County with nearby schools including Kimball Hill Elementary School, Carl Sandburg Junior High School, and Rolling Meadows High School.
Ownership History
Date
Name
Owned For
Owner Type
Purchase Details
Closed on
Aug 29, 2016
Sold by
Hall Scott and Hall Stephanie
Bought by
Aniol Denise D
Current Estimated Value
Purchase Details
Closed on
Apr 27, 2000
Sold by
Payne William and Payne Charmaine V
Bought by
Hall Scott
Home Financials for this Owner
Home Financials are based on the most recent Mortgage that was taken out on this home.
Original Mortgage
$144,036
Interest Rate
8.24%
Mortgage Type
FHA
Purchase Details
Closed on
Oct 25, 1994
Sold by
Arreguin Betty Anna
Bought by
Payne William and Payne Charmaine V
Home Financials for this Owner
Home Financials are based on the most recent Mortgage that was taken out on this home.
Original Mortgage
$92,250
Interest Rate
9.2%
Create a Home Valuation Report for This Property
The Home Valuation Report is an in-depth analysis detailing your home's value as well as a comparison with similar homes in the area
Home Values in the Area
Average Home Value in this Area
Purchase History
| Date | Buyer | Sale Price | Title Company |
|---|---|---|---|
| Aniol Denise D | $210,000 | Attorneys Title Guaranty Fun | |
| Hall Scott | $145,000 | Chicago Title Insurance Co | |
| Payne William | $123,000 | Attorneys Natl Title Network |
Source: Public Records
Mortgage History
| Date | Status | Borrower | Loan Amount |
|---|---|---|---|
| Previous Owner | Hall Scott | $144,036 | |
| Previous Owner | Payne William | $92,250 | |
| Closed | Payne William | $15,000 |
Source: Public Records
Tax History
| Year | Tax Paid | Tax Assessment Tax Assessment Total Assessment is a certain percentage of the fair market value that is determined by local assessors to be the total taxable value of land and additions on the property. | Land | Improvement |
|---|---|---|---|---|
| 2025 | $6,065 | $26,000 | $6,513 | $19,487 |
| 2024 | $6,065 | $23,767 | $5,511 | $18,256 |
| 2023 | $5,771 | $23,767 | $5,511 | $18,256 |
| 2022 | $5,771 | $23,767 | $5,511 | $18,256 |
| 2021 | $4,858 | $18,000 | $3,256 | $14,744 |
| 2020 | $4,817 | $18,000 | $3,256 | $14,744 |
| 2019 | $4,854 | $20,112 | $3,256 | $16,856 |
| 2018 | $4,452 | $17,181 | $3,006 | $14,175 |
| 2017 | $4,381 | $17,181 | $3,006 | $14,175 |
| 2016 | $4,753 | $18,575 | $3,006 | $15,569 |
| 2015 | $4,357 | $16,461 | $2,755 | $13,706 |
| 2014 | $4,270 | $16,461 | $2,755 | $13,706 |
| 2013 | $4,149 | $16,461 | $2,755 | $13,706 |
Source: Public Records
Map
Nearby Homes
- 2404 Sigwalt St
- 2202 Eastman St
- 2705 Park St
- 3100 Town Square Dr Unit 308
- 3209 Trillium Cir
- 2709 Lily Ln
- 3265 Kirchoff Rd Unit 116
- 2401 Rohlwing Rd
- 3345 Kirchoff Rd Unit 5C
- 2107 Kirchoff Rd
- 12 S Princeton Ct
- 3200 Thrush Ln
- 3407 Pheasant Dr
- 1506 W Northwest Hwy
- 3605 Oriole Ln
- 3710 Meadow Dr
- 3712 Jay Ln
- 2600 Brookwood Way Dr Unit 316
- 2600 Brookwood Way Dr Unit 305
- 2650 Brookwood Way Dr Unit 108