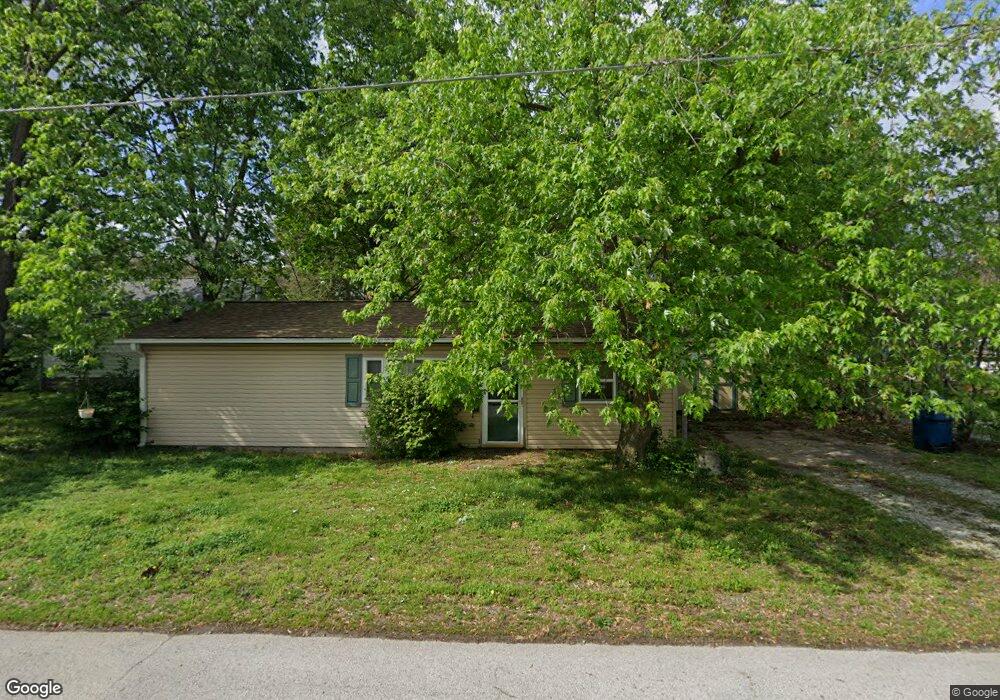
2406 Park St Terre Haute, IN 47803
Devaney NeighborhoodEstimated Value: $85,000 - $114,000
--
Bed
1
Bath
800
Sq Ft
$124/Sq Ft
Est. Value
About This Home
This home is located at 2406 Park St, Terre Haute, IN 47803 and is currently estimated at $99,140, approximately $123 per square foot. 2406 Park St is a home located in Vigo County with nearby schools including Adelaide DeVaney Elementary School, Woodrow Wilson Middle School, and Terre Haute South Vigo High School.
Ownership History
Date
Name
Owned For
Owner Type
Purchase Details
Closed on
Feb 26, 2010
Sold by
Miller Michael A and Miller Lisa M
Bought by
Strahla Exia K
Current Estimated Value
Home Financials for this Owner
Home Financials are based on the most recent Mortgage that was taken out on this home.
Original Mortgage
$39,176
Outstanding Balance
$26,313
Interest Rate
5.25%
Mortgage Type
FHA
Estimated Equity
$72,827
Purchase Details
Closed on
Aug 24, 2009
Sold by
U S Bank Na
Bought by
Miller Michael A and Miller Lisa M
Purchase Details
Closed on
Jul 16, 2009
Sold by
Mccoy Janann
Bought by
U S Bank Na
Purchase Details
Closed on
Dec 29, 2005
Sold by
Hood Karen E and Hood Daniel J
Bought by
Mccoy Don and Mccoy Janann
Home Financials for this Owner
Home Financials are based on the most recent Mortgage that was taken out on this home.
Original Mortgage
$43,500
Interest Rate
10.65%
Mortgage Type
Adjustable Rate Mortgage/ARM
Create a Home Valuation Report for This Property
The Home Valuation Report is an in-depth analysis detailing your home's value as well as a comparison with similar homes in the area
Home Values in the Area
Average Home Value in this Area
Purchase History
| Date | Buyer | Sale Price | Title Company |
|---|---|---|---|
| Strahla Exia K | -- | -- | |
| Miller Michael A | -- | -- | |
| U S Bank Na | $54,995 | -- | |
| Mccoy Don | -- | None Available |
Source: Public Records
Mortgage History
| Date | Status | Borrower | Loan Amount |
|---|---|---|---|
| Open | Strahla Exia K | $39,176 | |
| Previous Owner | Mccoy Don | $43,500 |
Source: Public Records
Tax History Compared to Growth
Tax History
| Year | Tax Paid | Tax Assessment Tax Assessment Total Assessment is a certain percentage of the fair market value that is determined by local assessors to be the total taxable value of land and additions on the property. | Land | Improvement |
|---|---|---|---|---|
| 2024 | $598 | $56,700 | $22,900 | $33,800 |
| 2023 | $589 | $55,100 | $22,900 | $32,200 |
| 2022 | $491 | $52,200 | $22,900 | $29,300 |
| 2021 | $536 | $56,200 | $26,800 | $29,400 |
| 2020 | $483 | $53,300 | $26,100 | $27,200 |
| 2019 | $466 | $52,200 | $25,500 | $26,700 |
| 2018 | $639 | $50,000 | $24,300 | $25,700 |
| 2017 | $409 | $48,500 | $23,200 | $25,300 |
| 2016 | $436 | $49,300 | $23,200 | $26,100 |
| 2014 | $351 | $44,100 | $19,500 | $24,600 |
| 2013 | $351 | $43,300 | $19,100 | $24,200 |
Source: Public Records
Map
Nearby Homes
- 941 S 25th St
- 1009 S 23rd St
- 2514 Crawford St
- 2520 College Ave
- 2518 Wilson St
- 2707 Oak St
- 1330 S 25th St
- 552 Monterey Ave
- 2800 Dean Ave
- 1000 S 19th St
- 1207 S 20th St
- 2932 Dean Ave
- 1800 Park St
- 1335 S 20th St
- 318 S 22nd St
- 805 S Brown Ave
- 1030 S 17th St
- 1116 S 17th St
- 1715 Thompson Ave
- 1220 S 17th St